
Launching today

Plotiq
Turn CSVs into charts instantly - no setup.
6 followers
Turn CSVs into charts instantly - no setup.
6 followers
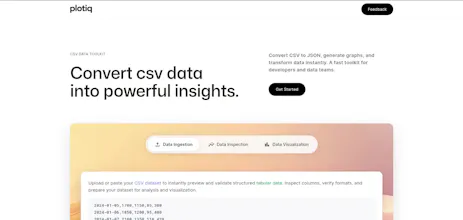
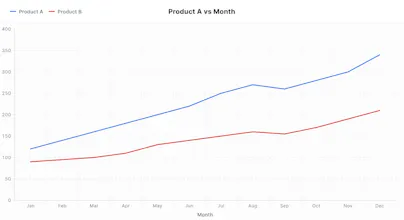
Plotiq is a zero-friction data visualization tool that lets you instantly turn CSV and spreadsheet files into clean, interactive charts - right in your browser. Just upload your data, and within seconds you can generate visualizations without writing code, installing software, or creating an account. It’s built for speed, simplicity, and accessibility, making data exploration effortless for anyone.
Hey everyone 👋
I built Plotiq to solve a simple frustration:
turning raw CSV data into charts quickly without heavy tools.
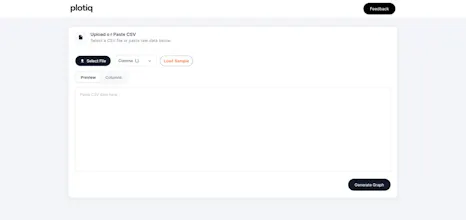
Just upload your CSV → get clean, ready-to-use charts instantly.
No login. No setup. Just paste and visualize.
I'm currently working on:
- shareable chart links
- more chart types
- better customization
Would love your feedback!
Congrats on the launch! The no-login, no setup part is very underrated. Most of my team doesn't need a full data tool, they just need to quickly make sense of a spreadsheet. This gets that done without the overhead. Once the shareable chart links are live, will there be a way to export the charts for decks and reports?
The shareable chart link feature you're working on would be really interesting :)