


Show PH: Heat Globe 🌍 – A stunning 3D interactive globe for data visualization (+ AI Analyst!)
Hey Product Hunt! 👋
I'm incredibly excited to share Heat Globe, a project I've been building to make exploring global data beautiful, interactive, and insightful.
What started as a simple data viz experiment has grown into a fully-fledged 3D platform. Whether you're looking at global GDP, population density, or trade networks, Heat Globe lets you visualize it all directly on an interactive 3D Earth.
✨ Key Features:
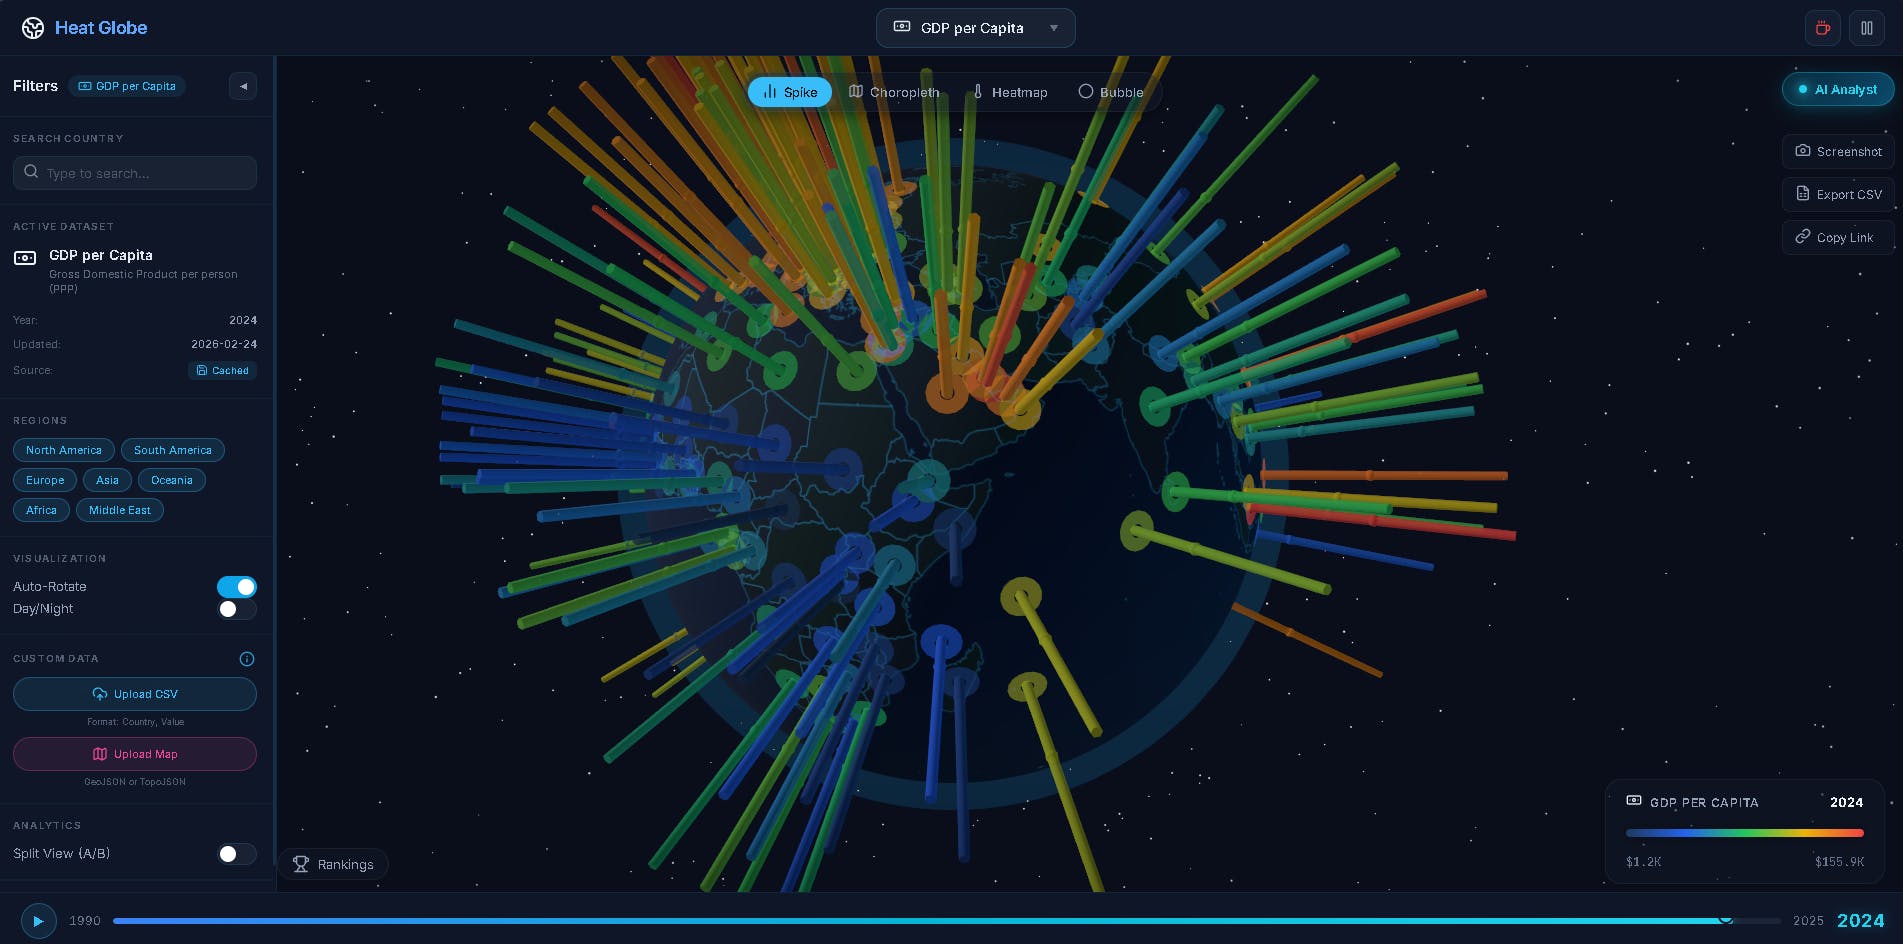
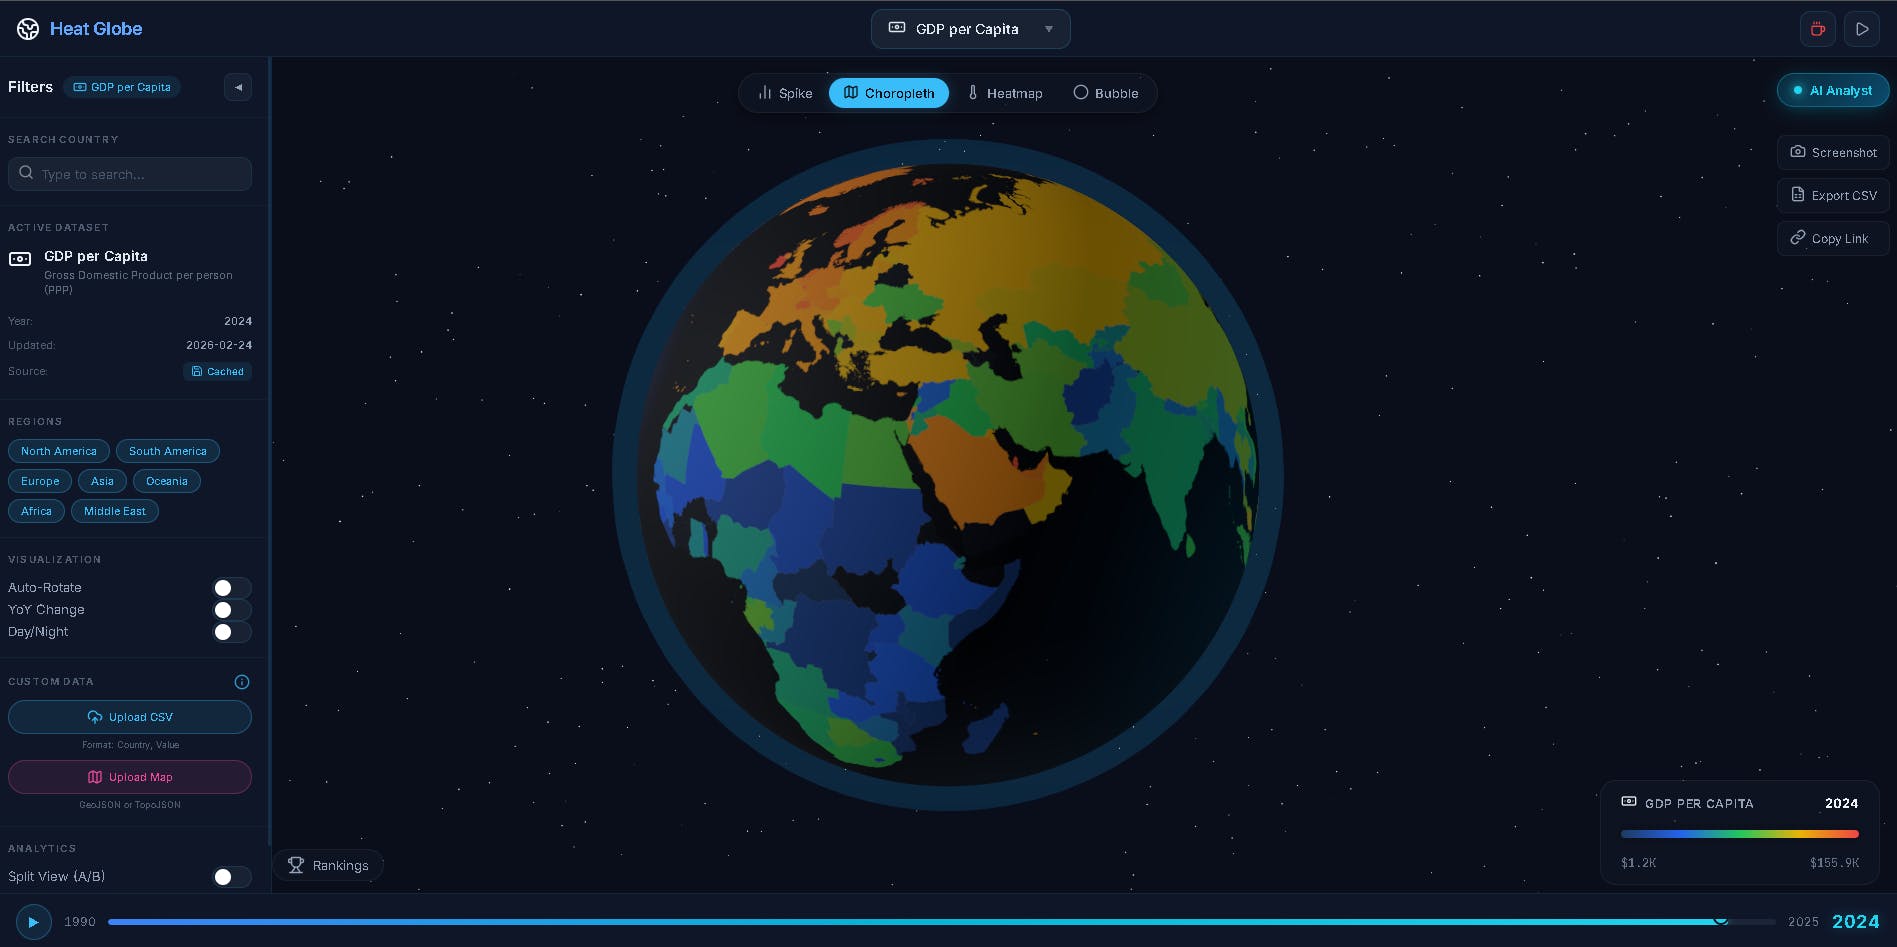
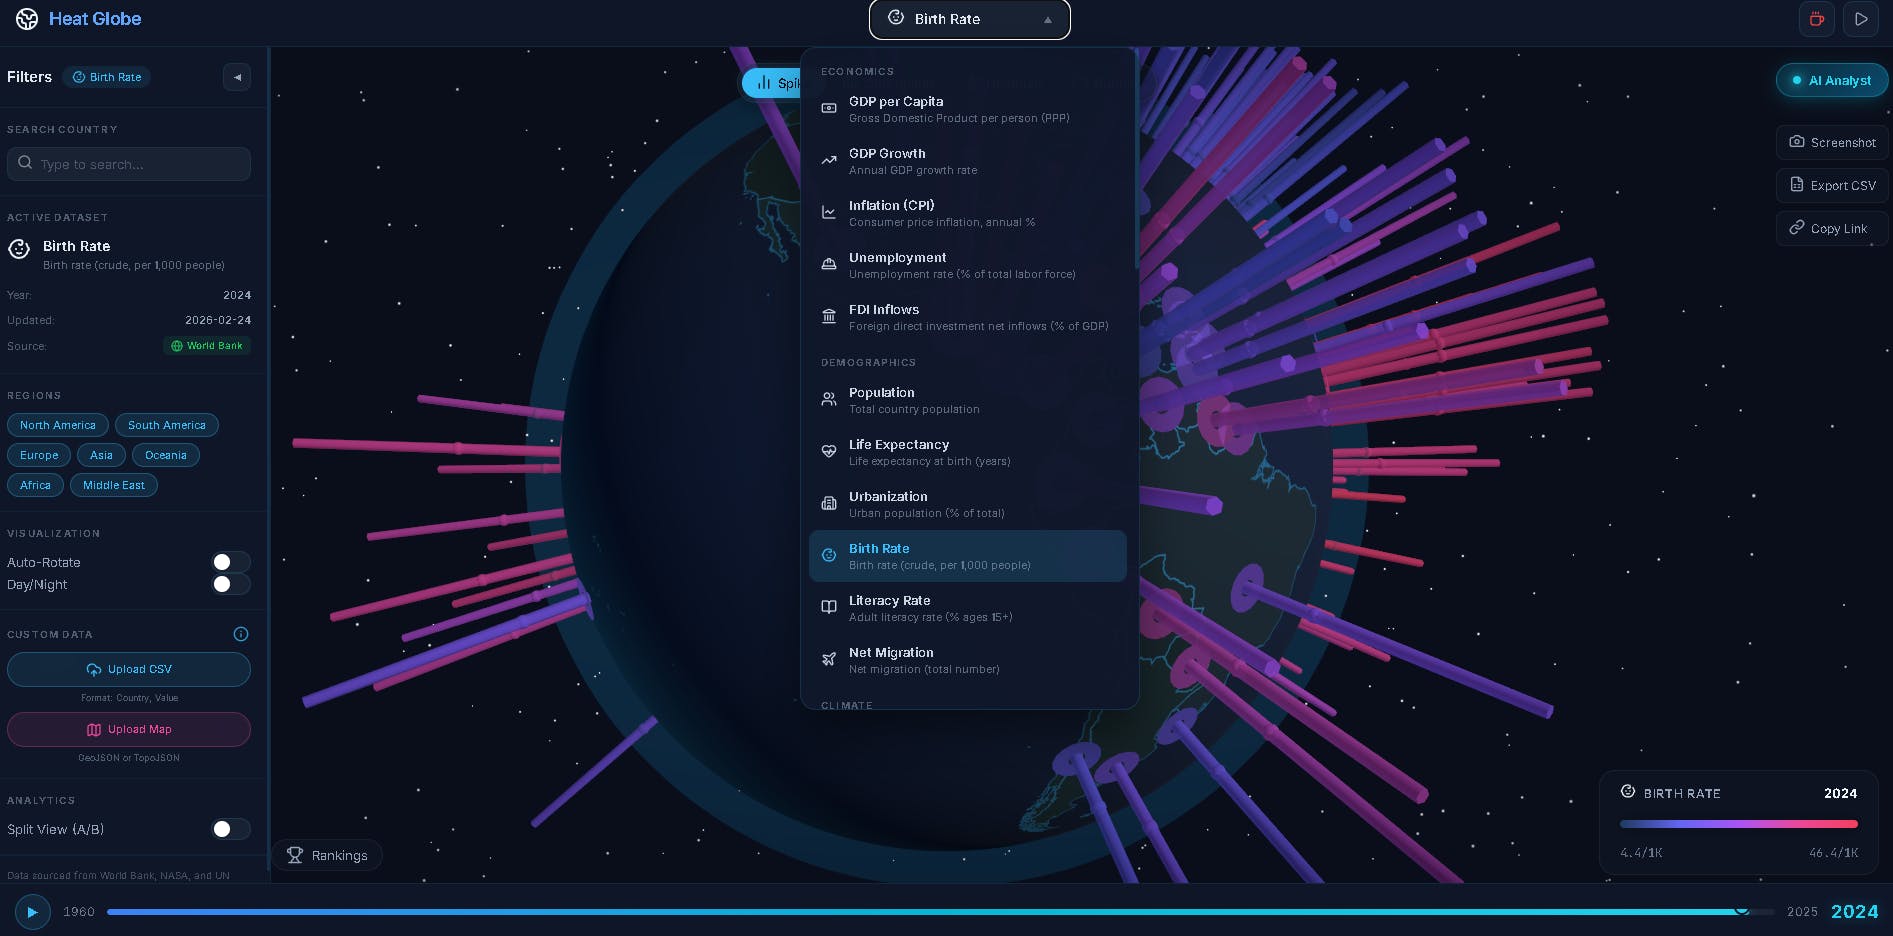
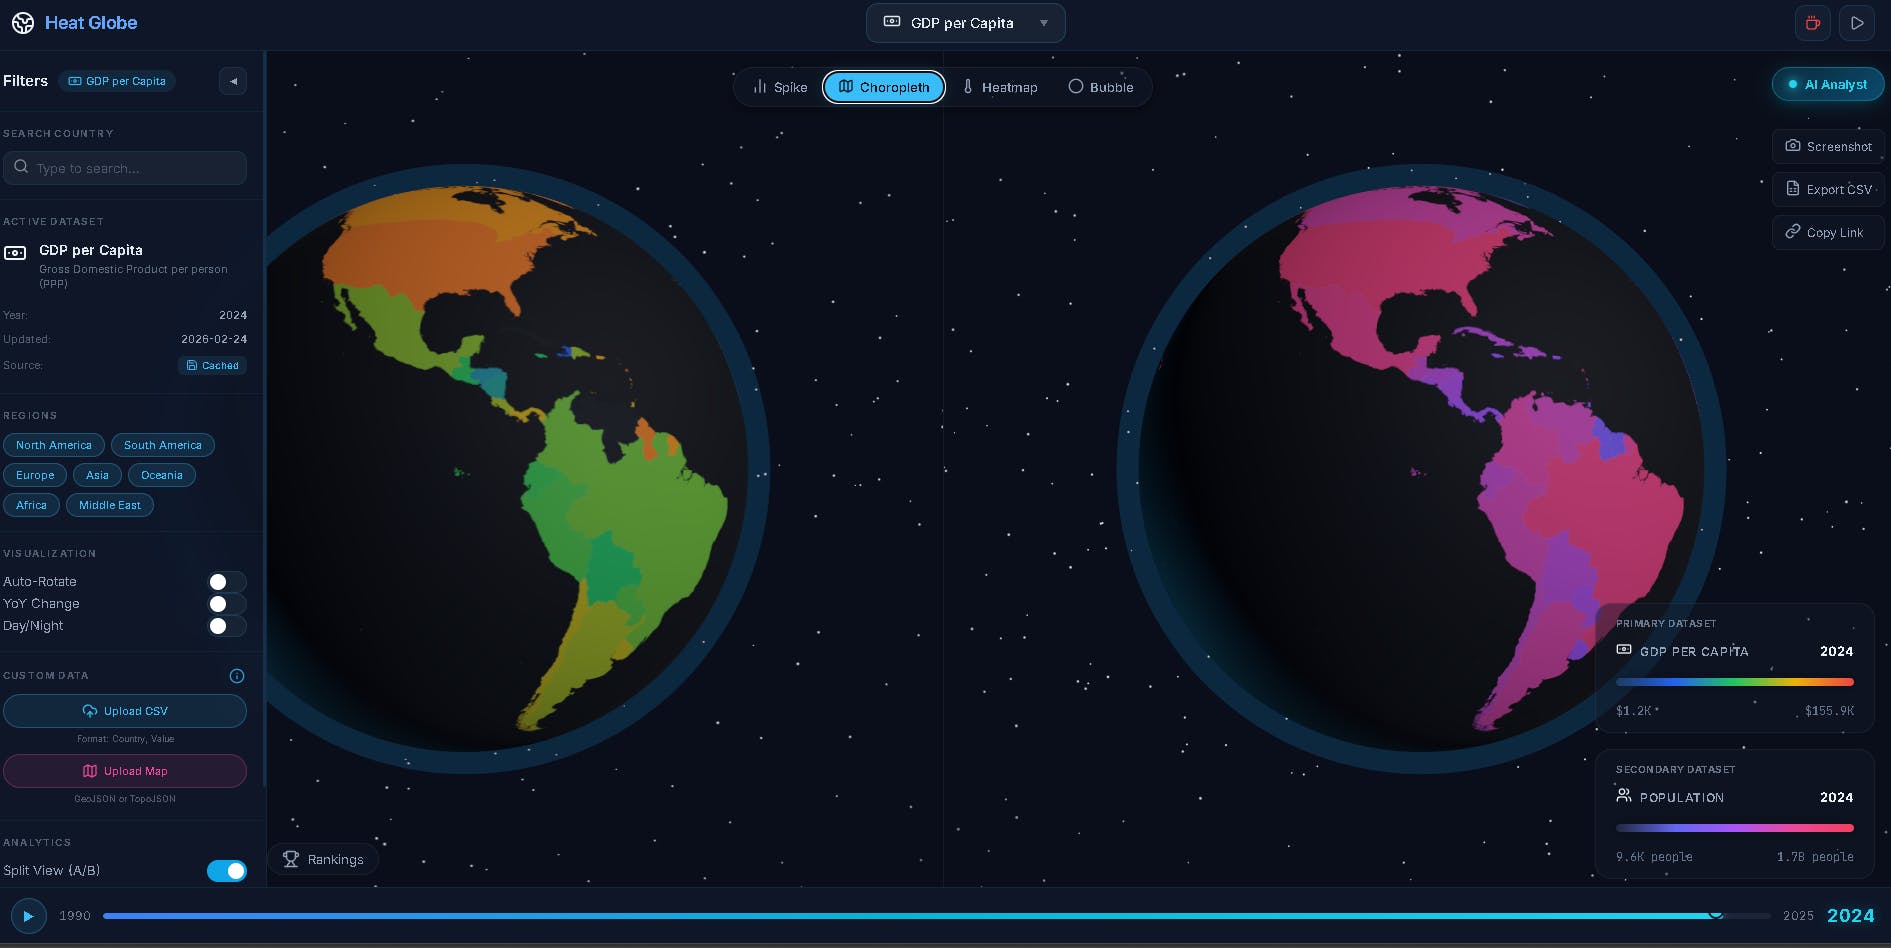
Multiple Visualization Modes: Switch seamlessly between Choropleth, 3D Spikes, Bubble overlays, and Heatmaps to find the best way to represent your data.
Custom Map & Data Uploads (NEW!): We just rolled out robust support for uploading your own custom GeoJSON/TopoJSON boundary maps along with a custom CSV dataset. The engine dynamically calculates centroids and properly scales projections on the fly. You can even map data onto completely custom fantasy planets! 🪐
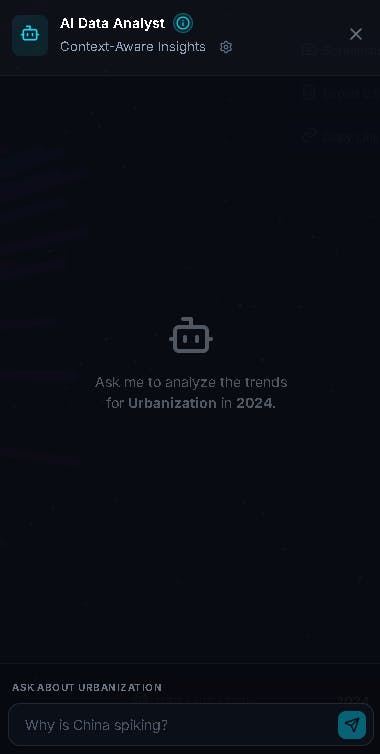
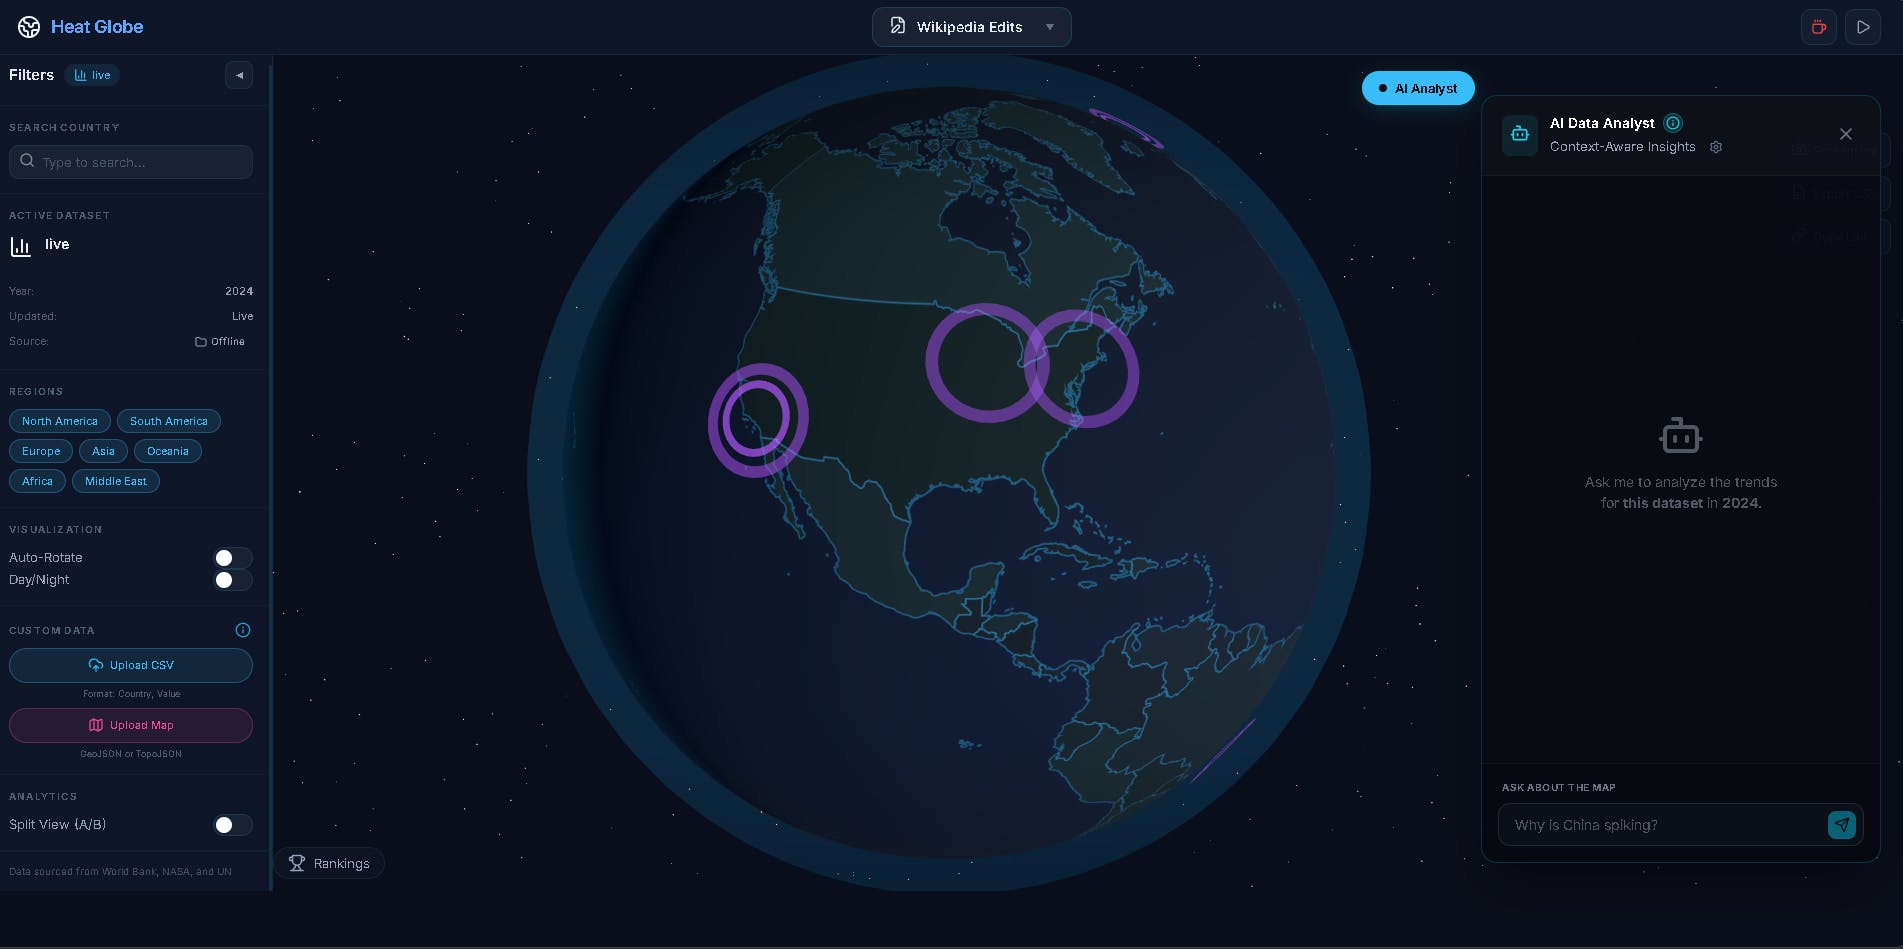
Built-in AI Analyst: Connect your OpenAI or Anthropic (Claude) API key to get instant AI-driven insights, summaries, and anomaly detection based on the dataset you are currently viewing.
Real-time Data Streaming: Hook up live WebSockets to visualize dynamic, constantly updating global metrics (like live shipping traffic or weather patterns).
Advanced Analytics: Compare different datasets side-by-side with our split-view A/B comparison and rankings panels.
We really wanted to bridge the gap between complex spreadsheets and intuitive, visually striking exploration.
I'd absolutely love to hear what the PH community thinks! What wildly obscure or interesting datasets would you want to map out? Any feedback on the UI/UX or features?
Thanks so much for checking it out! 🚀
Replies