


Top 5 Custom Jira Reports You Can Generate from a Simple Prompt
Jira teams often ask the same question: How can we get better visibility into what’s really happening in our projects?
Jira provides strong built-in reporting, but when teams want something slightly different, for instance, a new summary view, a custom dashboard gadget, or a report that combines data across projects, the usual options are limited. You either export data, install another plugin, or ask developers to build something custom.
My team has started a different approach: describing the report in plain language and letting AI generate the app that produces it. That idea became AI Apps Builder for Jira, and it’s what we’re launching on Product Hunt.
This article shares five practical reports you can generate from a simple prompt.
The Problem: Custom Jira Reports Are Harder Than They Should Be
Most Jira teams eventually find gaps in their reporting. You also may have questions such as:
Are we staying on track this sprint?
Which issues are starting to become risky?
Is our team’s velocity getting better or worse?
Who has too much on their plate across different projects?
How long does it actually take to finish work from start to end?
Jira offers many built-in reports, but they usually focus on single boards or predefined views. When teams want something more tailored, the usual paths are:
exporting data to spreadsheets
installing Marketplace plugins
asking developers to build a custom report.
None of these options is ideal if you simply want a custom report or dashboard gadget quickly.
A Different Idea: Describe the App and Let AI Build It
The idea behind AI Apps Builder for Jira is simple: Instead of writing code, you describe the Jira solution you want. The builder then uses AI to generate a Forge app based on your prompt. That generated app can be:
dashboard gadgets
custom dashboards
issue panels
global pages.
Everything runs on Atlassian Forge, so the generated apps follow Jira’s secure platform model.
5 Custom Jira Reports You Can Generate from a Simple Prompt
Below are five examples of custom reports Jira teams often request, along with prompts that can generate them using the builder. These examples focus on dashboard gadgets, which are among the most useful ways to visualize Jira data.
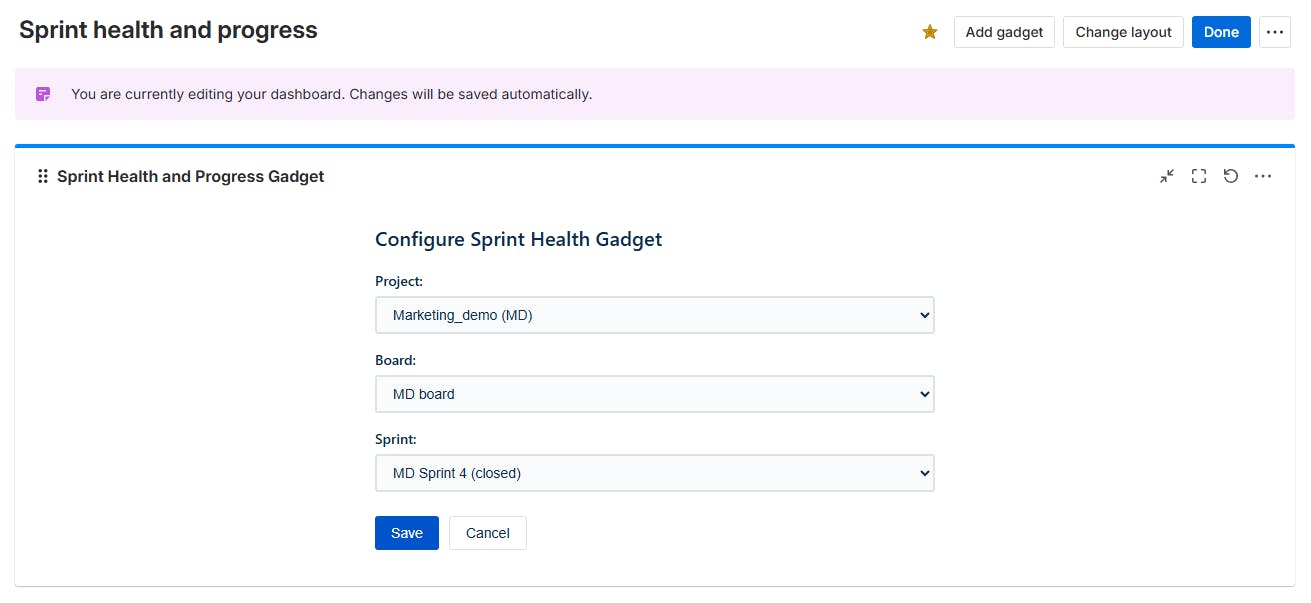
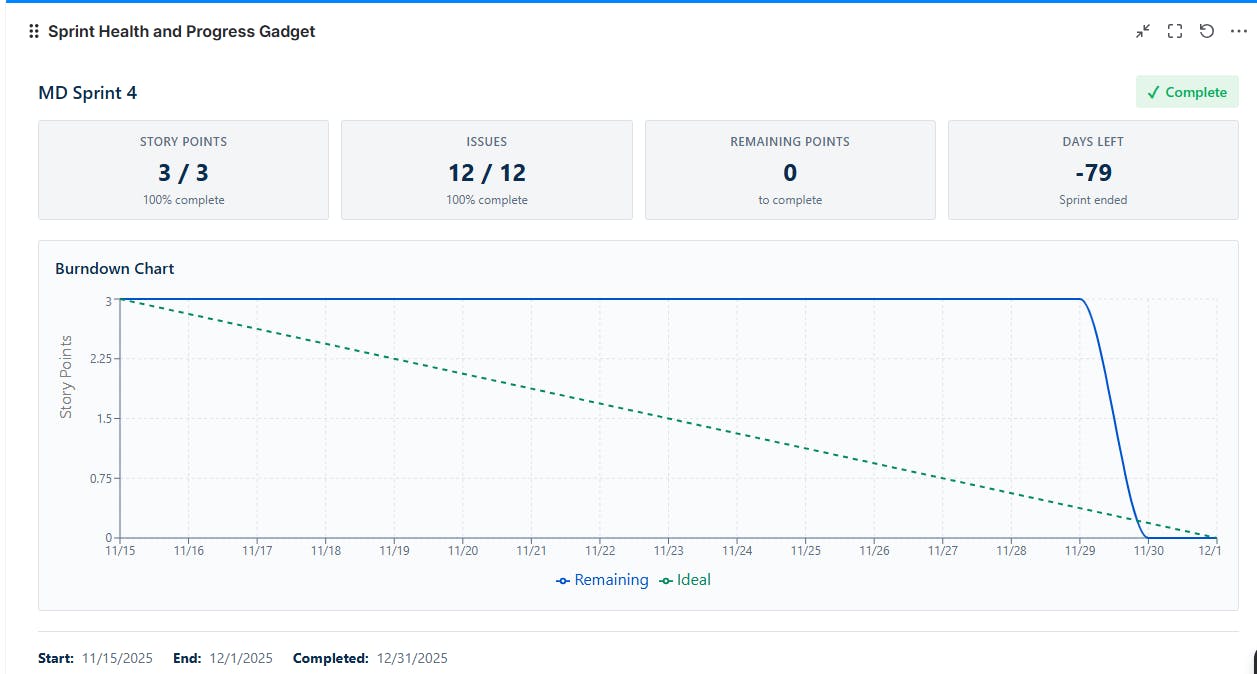
1. Sprint Health & Progress Report
Why do teams ask for this kind of report? Project managers often need a simple answer to the question: “How is the sprint going?” They want one view showing:
planned vs completed work
sprint burndown progress
remaining sprint days
early signals of delays or risk.
Example prompt:
“Create a dashboard gadget that shows the sprint health and progress. Add dropdowns to filter by project and by sprint. Include a burndown chart of remaining story points vs. time, a summary of committed vs. completed issues, and the number of days left in the sprint. Indicate whether the sprint is on track or delayed with color-coded status (green for on-track, yellow for at-risk, red for behind schedule).”
The generated gadget can then be added to a custom dashboard where stakeholders can monitor sprint progress.
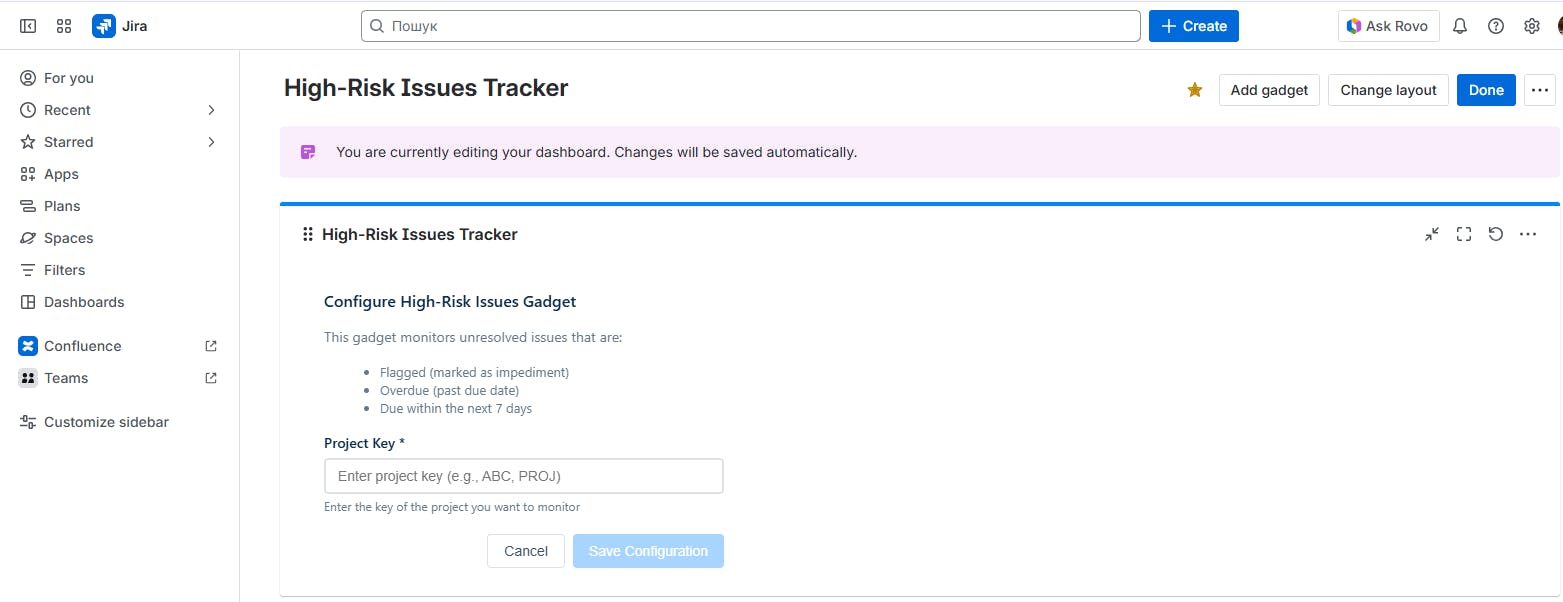
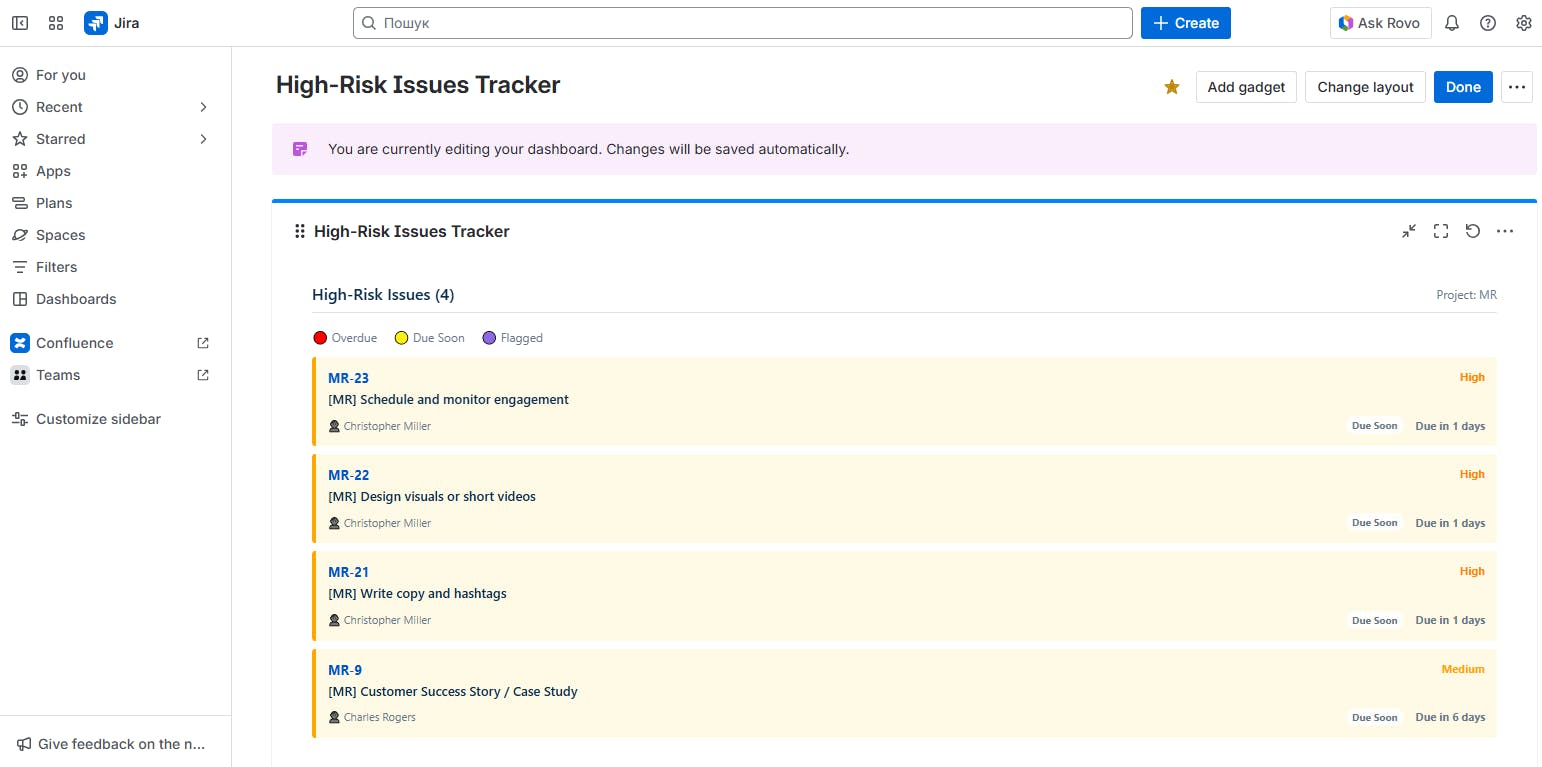
2. High-Risk Issues Tracker
Why do teams build this report? Every team wants to know: what’s late, blocked, or about to become a problem? This type of report combines several signals:
overdue issues
upcoming deadlines
flagged impediments.
Jira filters can display some of this data, but many teams prefer a single dashboard that automatically highlights risk.
Example prompt:
“Generate a dashboard gadget that lists all unresolved issues in my project which are high-risk. Define high-risk as any issue that is either flagged (marked as impediment) or has a due date that is past due or coming up within the next 7 days. For each issue, display the issue key, summary, assignee, priority, and how many days it’s overdue (or days until due). Highlight overdue issues in red and issues due soon in yellow.”
From this prompt, AI creates a risk-focused custom report that works well for stand-ups and stakeholder check-ins.
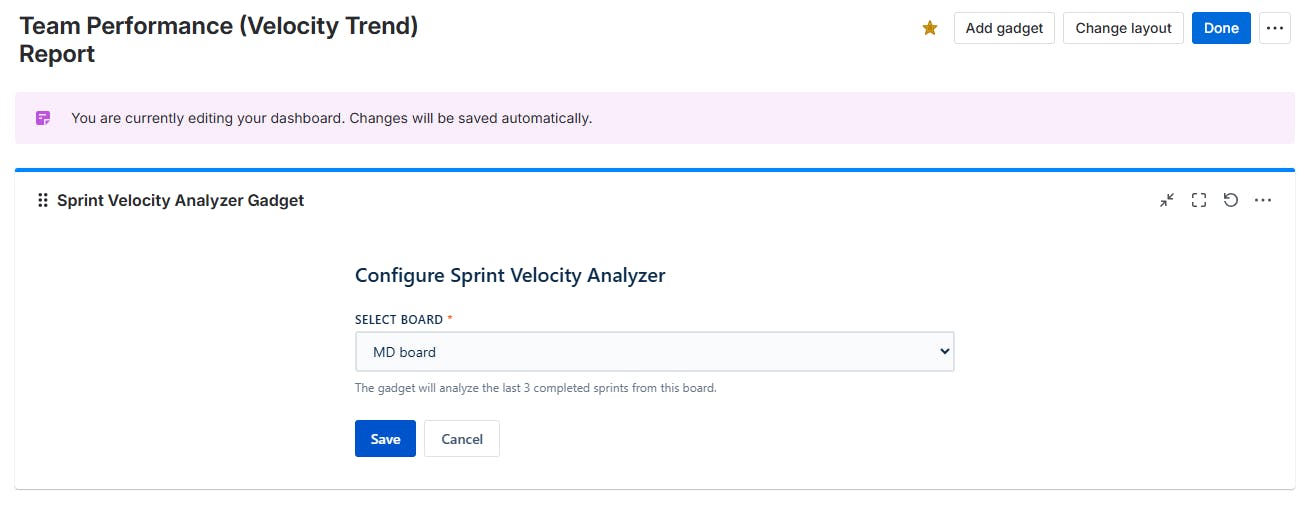
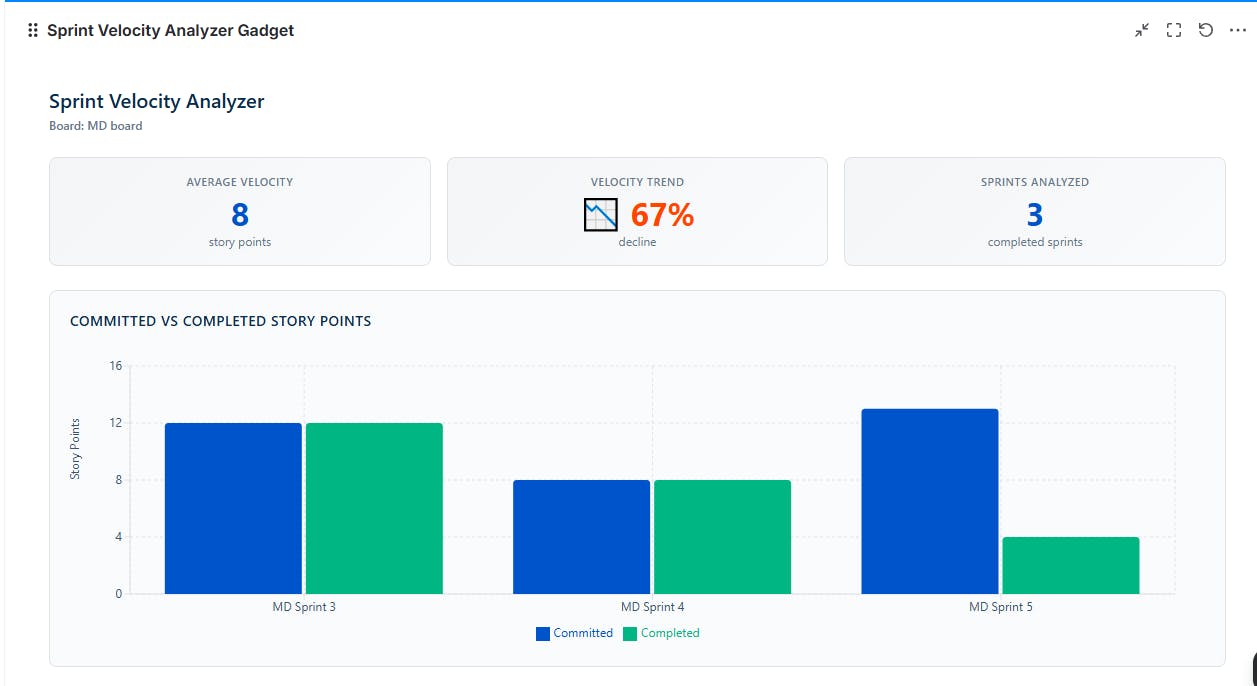
3. Team Performance (Velocity Trend) Report
Velocity is a popular Agile metric. In Jira, the Velocity Chart displays data for a single team’s board. While this is helpful, it does not show if your overall velocity is improving or how scope changes affect delivery across multiple teams.
Example prompt:
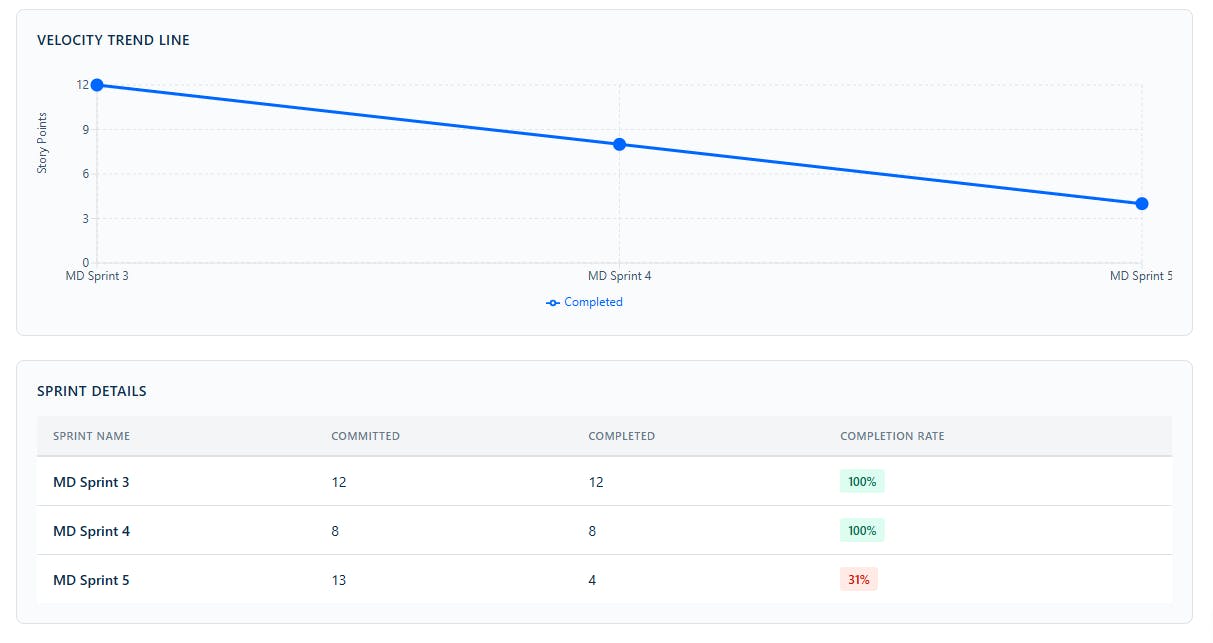
“Build a dashboard gadget to analyze our team’s performance across sprints. Show a velocity trend chart for the last 3 sprints, plotting story points committed versus completed in each sprint. Calculate and display the average velocity over this period, and include a trend line or percentage change to highlight improvements or declines.”
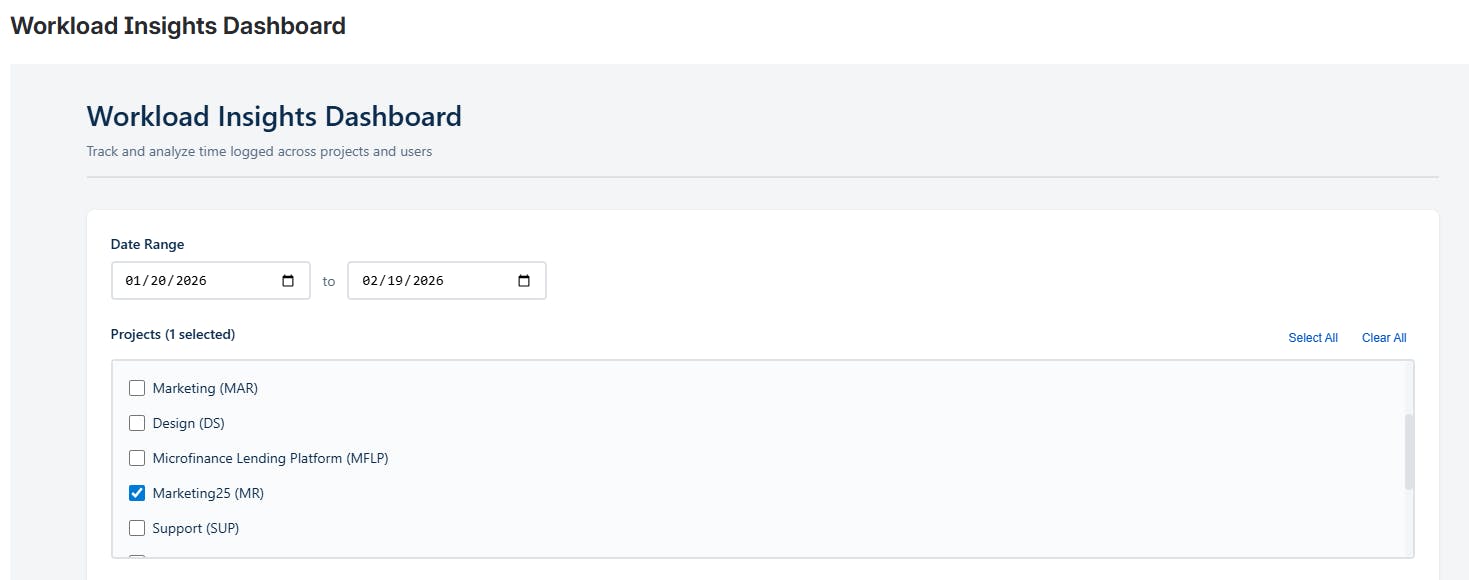
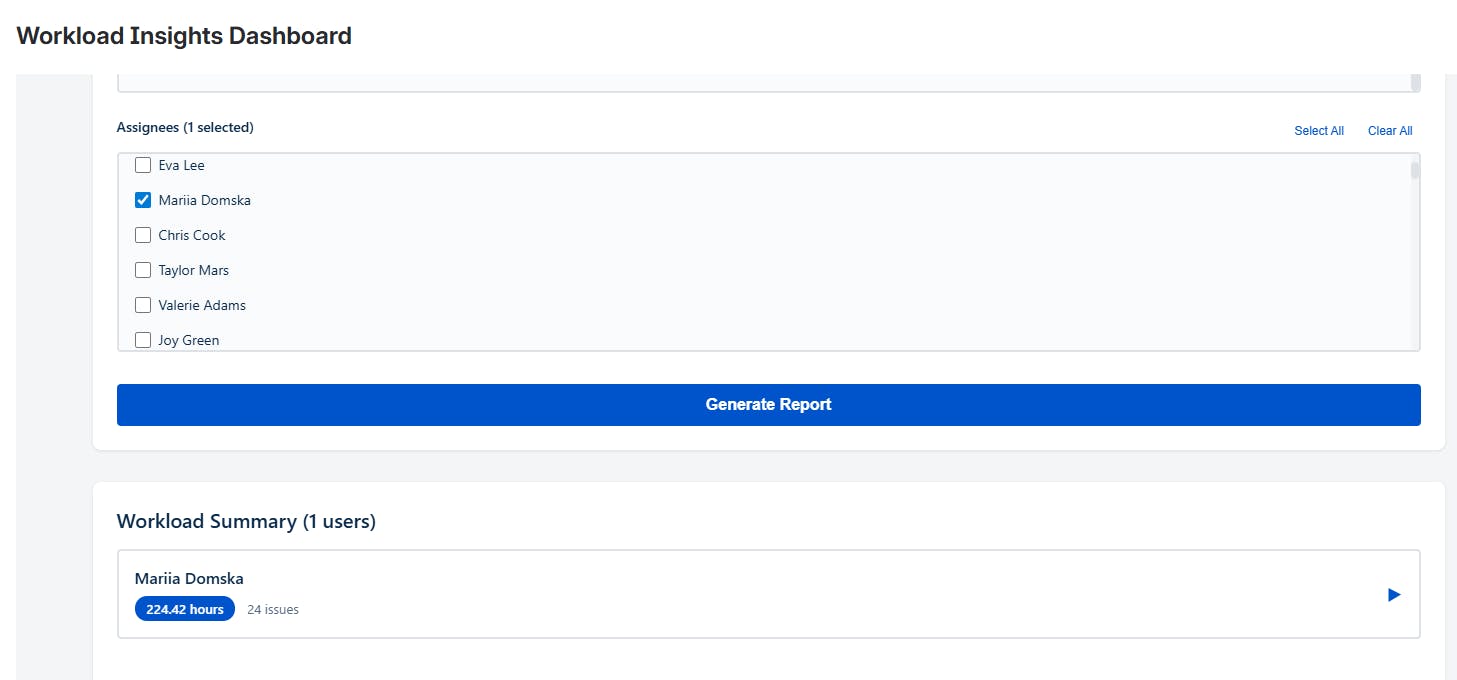
4. Workload Usage Report
Many organizations track worklogs in Jira, but it’s hard to see who is overloaded across multiple projects. Jira stores the data, but there isn’t always an easy way to view it interactively. A Workload Usage gadget can aggregate time tracking data and display it per user.
Example prompt:
“Create a ‘Workload Usage’ dashboard gadget that shows total hours logged per user within a selected date range. Add multi-select filters for project and assignee, and show only users who logged time in the selected period. When I click a user, open a table with issue key, summary, and hours logged for each issue.”
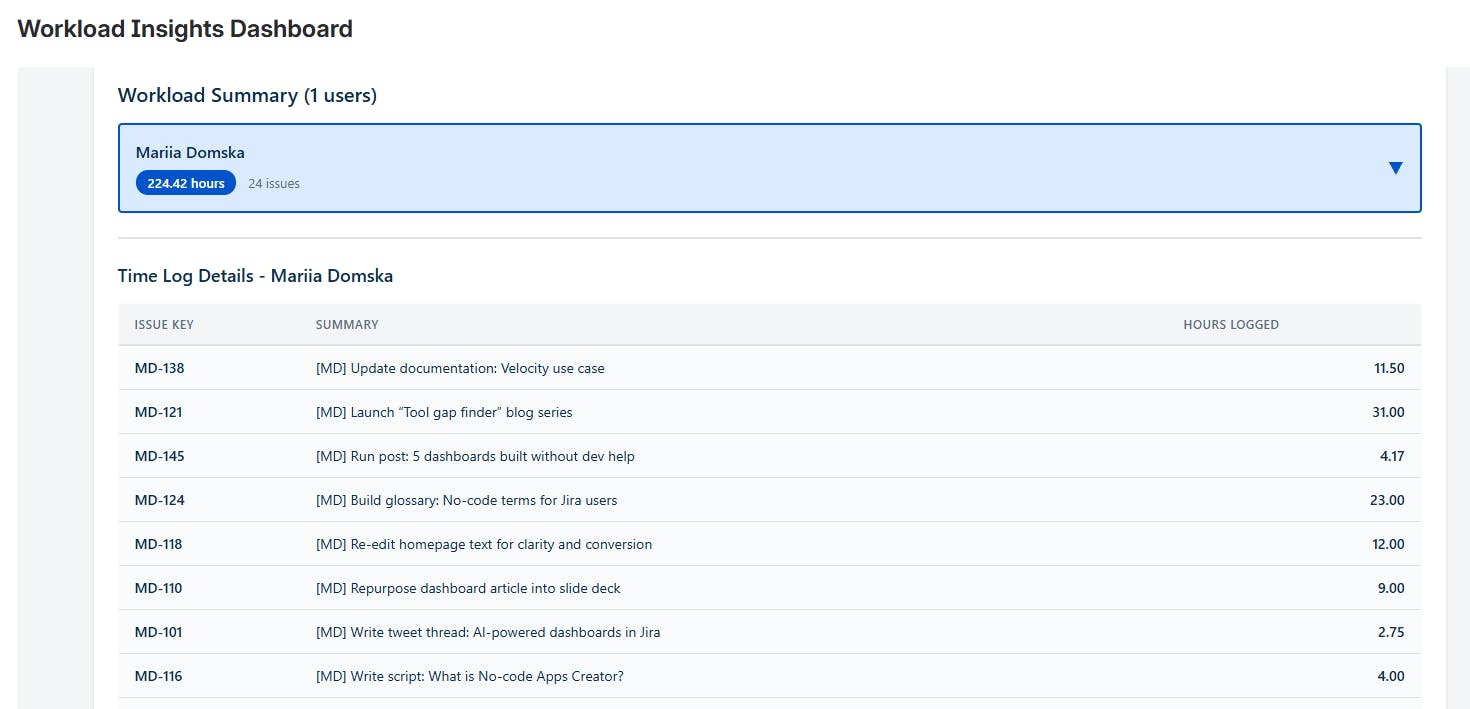
This report helps teams to:
See when someone has too much on their plate
Make sure that work is shared fairly across projects
Avoid the need for manual spreadsheet exports.
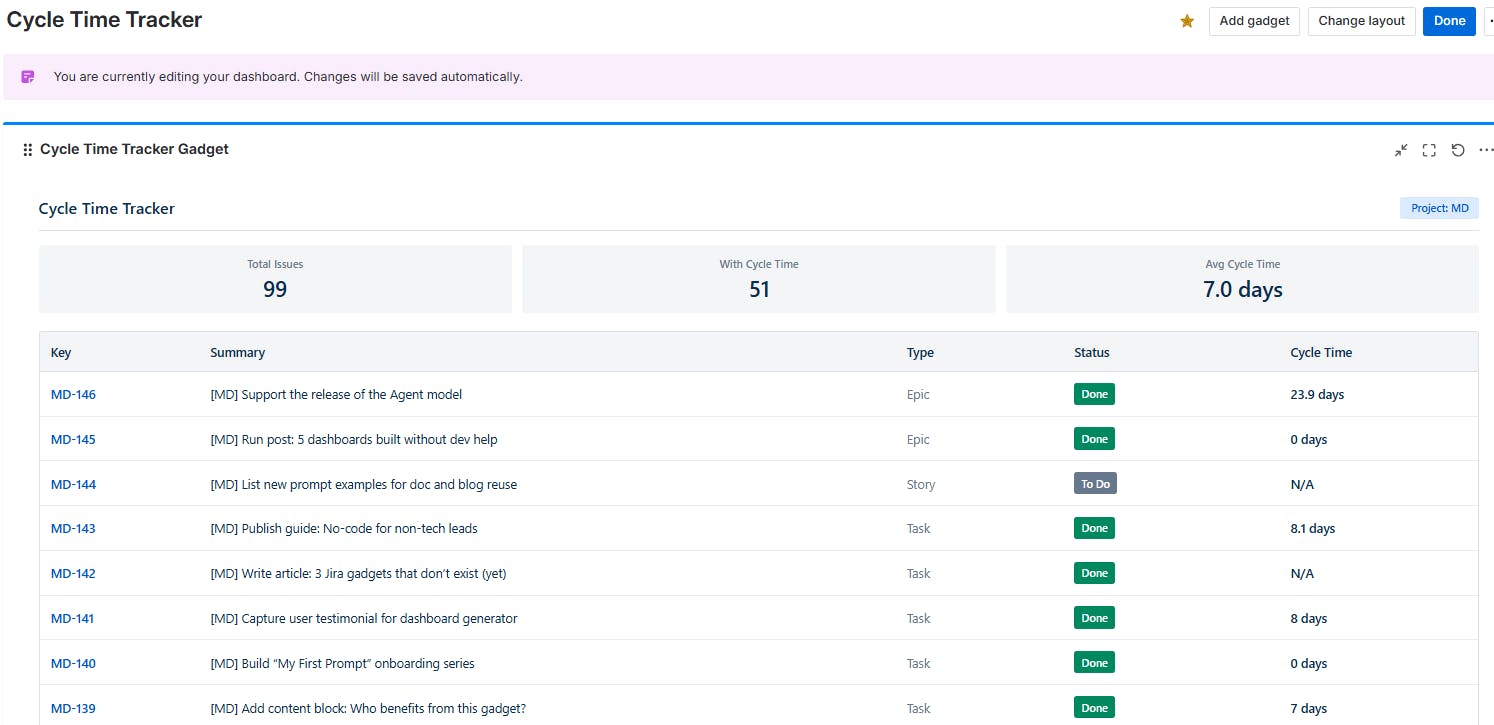
5. Cycle Time Tracker
Many Jira teams want to know:
How long does work really take?
Which issues take unusually long?
What is our average delivery speed?
Jira’s Control Chart is useful for visualizing team performance, but since it is tied to individual boards, it can be hard to get a summary across multiple projects.
Example prompt:
“Create a ‘Cycle Time Tracker’ dashboard gadget. Add a dropdown to select a project. For the selected project, show a summary with total issues, number of issues with cycle time, and average cycle time in days. Below, list all issues in a table with columns: key, summary, issue type, status, cycle time from ‘In Progress’ to ‘Done.’”
Who AI Apps Builder Is For
AI Apps Builder tends to be most useful for people who regularly customize Jira workflows, such as:
Jira administrators
Atlassian solution engineers
Product managers
Service managers
Engineering leads
Operations teams.
It’s particularly helpful when teams want to build a custom app or dashboard quickly before committing to development.
Final Thoughts
Jira users want Jira to answer questions like:
Are we on track?
What’s at risk?
Is the team improving?
Custom dashboards and reports help answer those questions, but building them traditionally can be slow. The idea behind AI Apps Builder for Jira is to make building easier: describe the solution, let AI generate the app, and iterate from there.
Try the Builder and Support the Launch
If you’re curious about this approach, we’d love to hear what you think. You can explore the launch here: https://www.producthunt.com/products/ai-apps-builder-for-jira/
If you work with Jira regularly, feel free to:
Try generating a custom dashboard or report
Share feedback on Product Hunt
Tell us what Jira problem you’d like to solve next.
Replies