
Launched this week

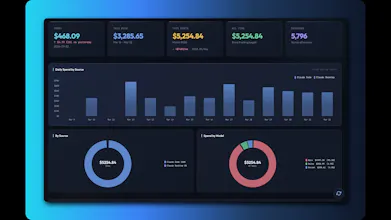
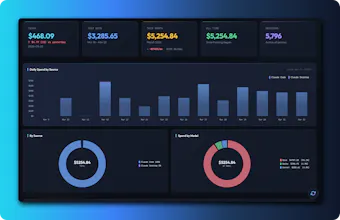
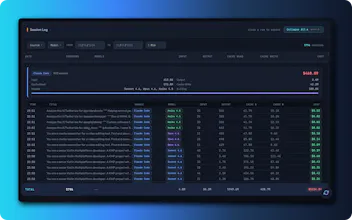
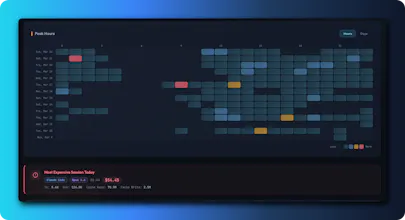
No single place shows your total Claude spend across tools. If you use Cursor, Claude Code CLI, Windsurf, Cline, or others — each burns tokens separately and you're flying blind. Claude Usage Tracker auto-detects 9+ tools, scans local session data, and shows everything in one dashboard: daily costs, model breakdowns, heatmaps, session logs, and monthly projections. Native macOS app or browser mode for other OS device. No cloud, no accounts, no telemetry. 100% free and open source (MIT).


SnapPay
It's dope bro!! When will you release the window version
@nathan_tran2 Thanks! It's macOS only for now. Windows support is something I'd love to do, it's on the roadmap but no timeline yet. Stay tuned!
@nathan_tran2 Just remember that we can also use on Windows with the browser mode. Check the guide detail here.
Clipboard Canvas v2.0
Love the idea of tracking Claude costs, but curious does it handle cases where users switch between multiple device?
@trydoff Great question! It's local-first so it reads data from each machine separately, but there's a built-in export/import feature - you can export your data as JSON from one device and import it on another to get a combined view.
BrandingStudio.ai
This solves a real problem. Right now I have a Chrome tab permanently open just to monitor usage, which is exactly the kind of friction that shouldn't exist when you're deep in a session.
The normalisation across tools is the hard part you probably don't get credit for in the headline. Each tool storing session data in different formats and locations means this isn't just a dashboard, it's a data pipeline with a UI. The zero setup auto-detection is what makes it actually usable rather than just theoretically useful.
The heatmap feature is the one I'm most curious about. I use Claude Code daily for building and I'd genuinely want to see whether my peak spend correlates with productive sessions or with the ones where I'm going in circles and burning tokens on context that isn't working. That could change how I structure my working day. Installing this today. Congrats on the launch!
@joao_seabra Thank you! The normalization layer was honestly where most of the work went - glad someone noticed.
Love your idea about using the heatmap to spot "going in circles" sessions vs. productive ones. Might explore that angle in a future update.
Would love to hear what patterns you spot!
Congrats on the launch!
I’ve been using Claude a ton lately across multiple tools as well, and keeping track of the total usage has honestly been pretty messy. I’ve been wanting a way to better control and understand my spend, so this looks incredibly useful.
@jordan_valuable Thank you! That's exactly the problem it solves. Hope it gives you the clarity you're looking for!
neat! so its like a more cracked OpenUsage tool? https://github.com/robinebers/openusage
Agen
@daniel_dorne Thank you for the upvote! Absolutely, as these tools become part of daily workflows, visibility into spend is essential. Hope it helps!
Great product
@subhasis_sahoo1 Thanks