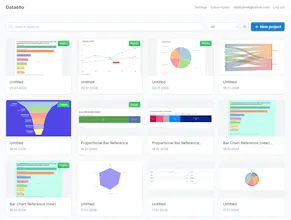
Dataello is a data visualization tool that turns spreadsheets into stunning, interactive charts. Create professional visualizations in seconds — no design skills or coding required. Just paste your data, pick a template, and publish. Perfect for researchers, marketers, and anyone who needs beautiful charts without the learning curve.
Hey everyone! 👋
I've been building software for market research and election polls for over a decade. Surveys, data crunching, statistical analysis - the whole thing.
But there was always one part I dreaded: making the charts.
Every. Single. Time. Export to Excel, fight with formatting, give up, screenshot it anyway. Or pay $500/year for tools that do what should take 30 seconds.
So I built Dataello for myself. A tool where I can paste data and get a beautiful chart immediately. No tutorials, no learning curve, no "upgrade to remove watermark" popups.
It's been my secret weapon for client reports and conference presentations. Now I'm making it public.
Report
Maker
🎉 Datello just hit 50 registered users!
When we started building Datello — a simple, powerful data visualization platform — we had one goal: make it ridiculously easy to turn raw data into beautiful, interactive charts. No steep learning curve, no bloated features. Just clean visuals, fast.
Today we crossed a small but meaningful milestone: 50 registered users.
We're still early. Still scrappy. Still shipping fast. But every new sign-up tells us we're solving a real problem — people want a lightweight, modern alternative to tools like Flourish that doesn't get in the way of the story their data is trying to tell.
What's next? More chart types, better customization, and a collaboration layer we're really excited about.
If you work with data and want a tool that respects your time, give Datello a spin. We'd love your feedback. 🚀
Report
No reviews yetBe the first to leave a review for Dataello Studio
🎉 Datello just hit 50 registered users!
When we started building Datello — a simple, powerful data visualization platform — we had one goal: make it ridiculously easy to turn raw data into beautiful, interactive charts. No steep learning curve, no bloated features. Just clean visuals, fast.
Today we crossed a small but meaningful milestone: 50 registered users.
We're still early. Still scrappy. Still shipping fast. But every new sign-up tells us we're solving a real problem — people want a lightweight, modern alternative to tools like Flourish that doesn't get in the way of the story their data is trying to tell.
What's next? More chart types, better customization, and a collaboration layer we're really excited about.
If you work with data and want a tool that respects your time, give Datello a spin. We'd love your feedback. 🚀