

JetMetrics — Revenue Intelligence
When revenue changes, know WHY — in minutes
25 followers
When revenue changes, know WHY — in minutes
25 followers
Metrics shows the real reasons behind Shopify revenue changes. You understand, explain, and decide what to do next — without hours of digging. Revenue dropped? A client asks why? Growth stalled? You know the feeling: jumping between dashboards, calling meetings, drilling into numbers — and the picture still feels fragmented. JetMetrics connects everything in one place. Built for people who explain metrics, not just report them. 14-day free trial. No credit card required.


A quick note on how the 30-day trial works — we extend trials manually, so it may take a few minutes after you install. To make it happen, just make sure you've activated the standard 14-day trial during onboarding — that's what we extend to 30.
Any questions — drop them here or reach us at team@jetmetrics.io, happy to help!
Hey everyone! I'm Dmitry, co-founder of JetMetrics 👋
So here's how this thing started... 🤓
We were doing customer discovery calls. You know, the classic "tell me about your pain points" conversations. And almost everyone said the same thing: "Checking metrics? Easy. I open Shopify, GA4, and Klaviyo. It takes me 3 minutes."
Cool. So no problem then?
"Well... figuring out WHY something changed? That can take hours. Sometimes days."
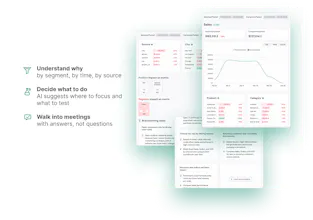
Turns out, every e-com person we talked to had the data. Plenty of dashboards, plenty of reports. What they didn't have was a way to see how metrics actually connect to each other. Revenue dropped - great, but is it traffic? Conversion? AOV? Repeat customers? The answer was always somewhere across 5 tabs and a spreadsheet that someone built 6 months ago and nobody remembers how it works.
So we thought: what if metrics weren't just a bunch of isolated numbers, but a visual map — with hierarchy and connections - where you can see what drives what?
That's JetMetrics. It turns your Shopify data into an interactive metrics map. Something goes red, so you trace the cause in seconds, not hours. No data science degree required (We checked!🥸)
We've been working on this since 2022 and launched on Shopify in 2025. Still early, still hungry, still fixing things at 2am.
Genuinely curious... what's the most frustrating part of understanding your store's performance? We're shaping this product based on real feedback, and yours actually matters. Not in a "we value your input" corporate way. For real.
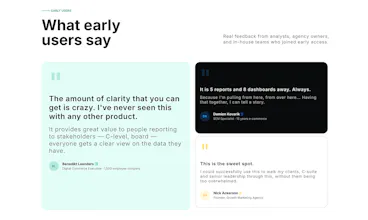
Our first App Store review said: "I'm a visual learner running a growing ecommerce brand, and I've always found raw Shopify data more overwhelming than useful."
That's exactly who we built this for.
Most Shopify merchants run ops, logistics, marketing, and customer support simultaneously — no analyst on staff. When revenue drops, they need to see WHY instantly, not dig through 50+ reports.
We built 3 visual causal maps of 47 metrics that show how business KPIs connect to each other. 3 product pivots. Closed beta with paying customers. Scaled the infra 100x in 4 months — two engineers. Now public.
Ask me anything.