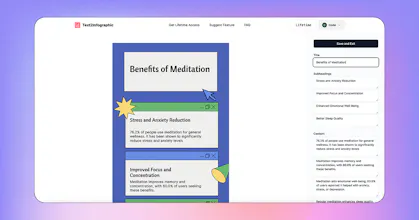
Text to Infographic is an AI Infographic Generator that turns your text into visuals for your blog, social media, and more. Put in a simple topic or blog post link. Our tool will do research, get copyright free graphics, and make multiple eye catching visuals
Hey Product Hunters! 👋
I'm Avi Arora, aka c0delemons, the creator of Text to Infographic, an AI-powered tool designed to transform your written content into visually appealing infographics effortlessly.
As a content creator, I faced the challenge of turning my blog posts into engaging infographics to promote my projects on social media. Infographics are fantastic for making information succinct and digestible, plus they're great for building backlinks. However, creating infographics usually demands a good eye for design and at least an hour to condense information, find relevant graphics, and finalize the design. Existing solutions are often bundled with larger graphic design tools, requiring a monthly subscription, while I just needed a tool for this specific use case.
That’s why I developed Text to Infographic, the AI Infographic Generator that:
Conducts its own research
Gathers relevant images
Cites its sources
Text2Infographic simplifies complex data visualization and communication. It converts textual information into engaging, easily understandable infographics, aiding businesses, educators, and content creators in making data-driven insights more accessible and actionable. The value lies in enhancing comprehension, engagement, and retention of information through visually appealing and interactive content.
🌟 Key Features:
🔍 Automated Research: The AI conducts its own research to ensure accurate and relevant information.
🖼️ Image Gathering: It sources copyright-free vector graphics for your infographics.
📚 Source Citing: All sources are cited, ensuring your content is credible and reliable.
✏️ Powerful Editor: Allows users to customize content, fonts, and watermarks.
🌍 Internationalization Support: Generate infographics in any language.
💵 One-Time Purchase: Use the tool forever without any recurring fees.
I’m excited to hear your feedback and suggestions for new features you’d like to see. Let’s make data visualization easy and fun!
Looking forward to your thoughts and ideas!
Cheers,
Avi Arora (c0delemons)
Report
@codelemons Hi
How are sources cited and what steps are taken to ensure the accuracy of the content?
Are there any examples of using Text to Infographic in real projects or case studies that you could share?
How does your system handle data security and user privacy?
@mksaint13 The tool performs google searches based on the topic you enter and cites any websites it visits. It uses the content from those pages to inform the infographic content.
I don't have any case studies unfortunately but that is a good idea to demonstrate the potential use cases more clearly.
In terms of privacy, we try to follow best practices to keep user data secure. All infographics created by premium users are private, unable to be viewed by others, and not indexed by search engines. More details in our privacy policy :)
Congrats on the launch! This is awesome and I love the concept! I do have a few pieces of feedback. First, I expected the box on the home page to submit my query when I pressed enter, and it took a few seconds of waiting to realize that it created a newline and scrolled my original query off-screen. I'd recommend enter to send or making the text box larger. Second, the style feels old to me. I don't know how to explain it, but the examples and the ones I generated just don't feel modern. Third, I wasn't impressed with the coherence between the content and the graphic layout -- it implied a sequential progress when they were just separate facts. Finally, I think some companies would appreciate being able to specify their branding, for example colors, for the generated infographic. I know this is a lot of feedback, but I spent the time typing it all out because I haven't seen something like this before and I think it has demonstrated a ton of potential and just needs tweaking. Wishing you all the best!
@jack_michalak Wow Jack, this feedback is so valuable to me. Thank you for taking the time to write this up.
I will be adding a ‘content’ mode with a much bigger text box for people to paste in large blurbs of content or upload from a pdf/docx.
I will definitely continue to add more templates. It sounds like you like more sleek and modern design and I’m sure a lot of people agree, so I’ll make that a priority :)
In terms of layout, you’re right the current offerings all imply some sort of ‘steps’ or logical progression. I think this can also be solved by adding more templates with this in mind
In terms of custom branding, this is on my feature roadmap and will 100% be built. I am working in an svg color customizer at the moment which will allow users to change the background & any image colors. This will also unblock me and allow me to build the custom brand color palette feature!
@codelemons Great, sounds like you're on top of everything, keep it up! :)
Report
Looks awesome but to try this out wouldn't people will need more credits? I understand the cost issue but I suppose for a startup you will anyway get a lot of free credits from LLM companies like Azure, Google or OpenAI.
@aishwarya_singhal You bring up a fair point! Currently I haven't applied to any programs such as Microsoft for Startups so I am paying for all the credits out of pocket. This would definitely ease the financial burden and allow me to give more free credits on sign up!
Report
Congrats on the launch! This is helpful for a lot of bloggers and content creators. I know many who create and spend a lot of time on creating infographics for twitter and Instagram, this will save them a ton of time
@glen_dsouza_1 I'm really happy that you see some value in the product idea, that is very encouraging to me!!
Report
Hey, just tested it, it's really a nice and useful project, and I know the tech behind it is good ! 👌 (just the pricing on the footer seems to bring you on the homepage)
@franckwebpro Thanks for pointing that out!! I will fix it right away :)
Report
I've always thought that advertising is one of the best areas to use AI, and I'm excited to see it finally coming to fruition. Congrats on the launch!
Report
Really like this and the data is pretty correct (I noticed some inconsistencies within the data it pulled but, the sources did cite those numbers so eh). Would really like the ability to change the background colors of the infographics to align with the brand, but, otherwise, I am pitching this to management :D



Text2Infographic
Text2Infographic
Resubscribe
Text2Infographic
Resubscribe
Text2Infographic
Text2Infographic
Text2Infographic