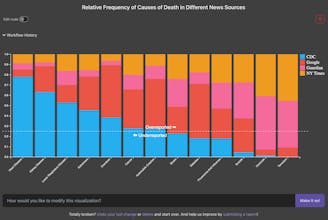
Vizzy uses ChatGPT to visualize any kind of data. Upload JSON, CSV, XML, or anything else, and ask Vizzy to create charts, graphs, maps, or any other kind of graphic. Vizzy is 100% open source, MIT license
great. can i ask you what is monetization plan? and did u use your custom gpt ? or everytime you submitting prompt?
Report
Congratulations on the launch! It's clear that work has been done, but 1. Chat can build graphs 2. Your graphs are visually not very pretty. Will you improve the visual component?
@bpolyak Thanks!
ChatGPT can build some simple graphs, but the development loop is frustrating. It's also very limited--e.g. no maps. I have a chat here that shows some of the limitations: https://chat.openai.com/share/2e...
I'm starting to build a "style guide" that that guides ChatGPT to build graphs with particular styles in mind. Definitely a work in progress! https://github.com/rbren/vizzy/b...
Report
Might be wrong, but can ChatGPT not do this already?
@oliver_bahne So you might be confusing this with ChatGPT's ability to output images, e.g. "a teddybear skateboarding in times square".
GPT can also execute python code, which allows it to display some simple graphs directly in the chat console. But there's also no way to upload a custom dataset (AFAIK) and have it use that--it has to be data that fits inside the context window. (Edit: this seems inaccurate, but I have a chat that shows some of the limitations of ChatGPT here: https://chat.openai.com/share/2e...
That said, we are building on top of ChatGPT, so hypothetically anything you can do with Vizzy you could do with ChatGPT. But it would involve a lot prompt engineering, and a lot of copy-pasting code in and out of the ChatGPT interface. Vizzy allows for a rapid development loop.
Report
@rbren with the paid version of ChatGPT you can upload CSVs and ask it to analyze data.
@oliver_bahne Yup you're right! I actually didn't know this. I've been playing with it, and there are still a lot of limitations in the vanilla ChatGPT experience. Edited my comment above to reflect that
Report
Congratulations on the launch! 🚀📊 Introducing Vizzy, the data visualization tool powered by ChatGPT. Simply upload JSON, CSV, XML, or any data format, and let Vizzy create charts, graphs, maps, and more. It's 100% open source with an MIT license. Explore the power of data visualization with Vizzy!
OpenDevin
OpenDevin
OpenDevin
OpenDevin
OpenDevin
Emma Intelligence
OpenDevin