Quick question for this community before we launch: how do you currently keep tabs on your numbers day to day?
Most people we talked to do one of two things. Either they open the same dashboard every morning out of habit, even when nothing's changed. Or they don't check often enough, and by the time they notice something's off, it's already cost them a few days.
Databox MCP connects your business data to Claude, ChatGPT, Cursor, and n8n. Ask about revenue, campaigns, or pipeline in plain language and get answers grounded in your real metrics and business context.
Genie is an AI analyst built into Databox. Ask questions about your business performance and get instant insights from your data, so your team can quickly understand what’s driving results and take action.
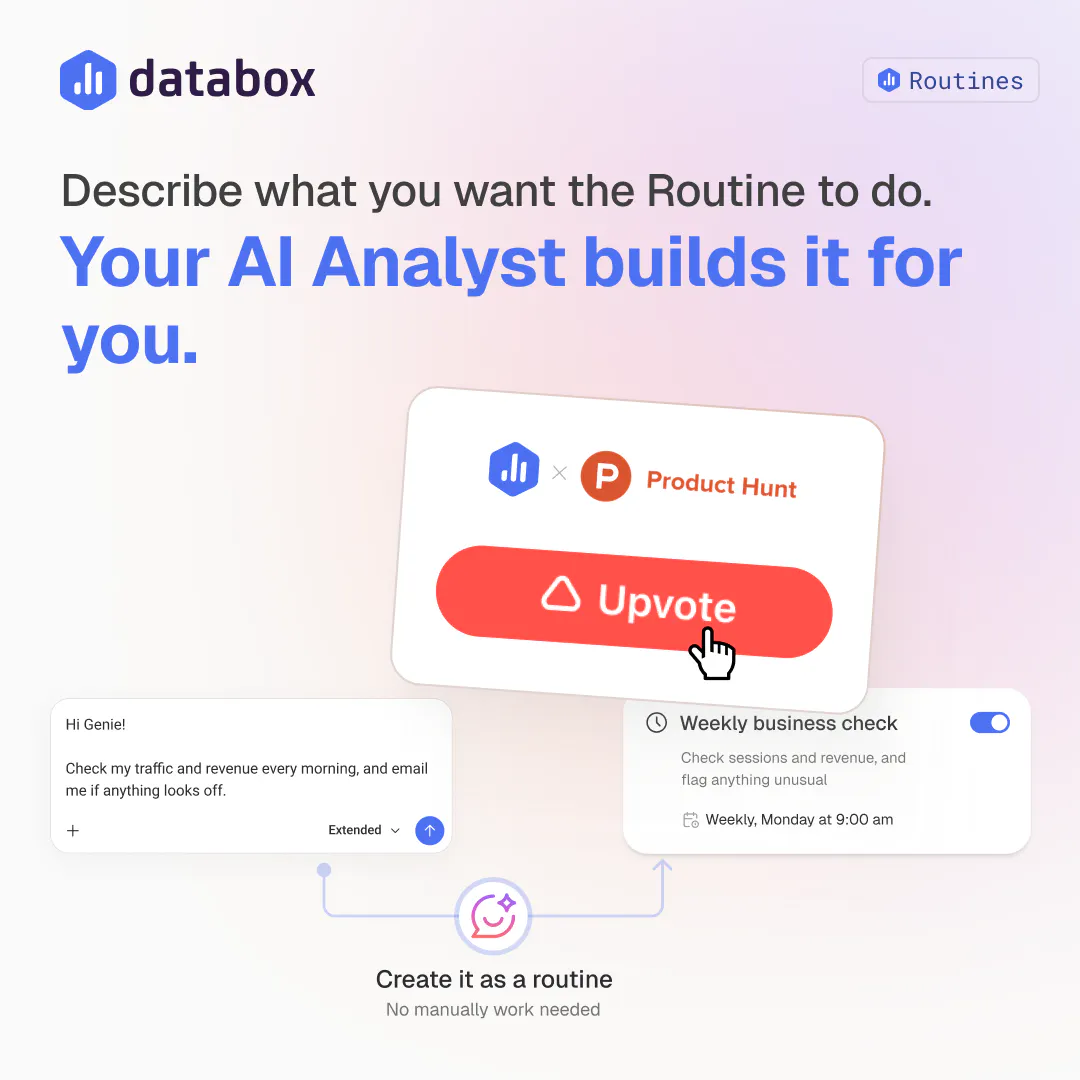
Checking on the business is a ritual - daily, weekly, monthly - and today it's entirely manual. You open the same tools, scan the same numbers, and rebuild the same report, over and over. Whatever falls outside that routine goes unnoticed, and by the time something unusual gets investigated, it's often too late to matter.
Custom Integrations lets you connect virtually any API to Databox without writing code. Turn API responses into structured datasets and analyze them alongside your other sources to get a complete view of performance.
We've been thinking a lot about this moment. A stakeholder asks "how did our paid campaigns do last week?" or "are we on track for the month?" - and even with dashboards already built, getting a clean answer still takes more steps than it should.
You open the right tool. Filter the right date range. Cross-reference another source. Paste it into a Slack message. Sometimes you just end up saying "let me get back to you on that."
The data exists. The dashboards exist. But the path from question to answer still has too much friction in it.
That's the problem we set out to solve with Databox MCP - launching on Product Hunt May 28. Instead of navigating dashboards, you ask the question directly in whatever AI tool you already use - Claude, ChatGPT, n8n, Cursor - and get an answer pulled from your live data.
It's Monday morning. You need the GA4 numbers for the team standup, so you export a CSV, upload it to your AI tool of choice, and start typing context it doesn't have - what's a good conversion rate for you, which channels actually matter, what "normal" looks like for your traffic.
We just made that whole loop unnecessary.
Skills Marketplace by Databox is a free library of plug-and-play AI analytics skills and workflows. Pick one - GA4 traffic, LinkedIn performance, Google Ads, SEO visibility, and more - connect your data sources once through Databox, and your AI tool pulls live numbers with real context built in. No CSV exports, no re-explaining your metrics every time, no hallucinated benchmarks filling in the gaps.
Yesterday (June 1st), we launched Databox MCP, and we finished #3 Product of the Day!
This wouldn't have happened without the dedicated and highly engaged team in Databox and this community. The upvotes, the comments, the shares - and everyone who followed along and took the time to try it. You helped us validate that people genuinely want to chat with their business data from the AI tools they already use.
Most analytics tools give you a dashboard. You open it, look at it, and go back to your spreadsheet to answer the actual question.
We just changed that.
Databox MCP connects your business data to the AI tools you already use - Claude, ChatGPT, Cursor, n8n. Instead of building dashboards to get answers, you just ask. What happened to your CAC last week? Which campaign drove the most revenue? Your AI does the math using your real metrics, definitions, and historical context - and gives you an answer you can act on.