


Guess what day most people lose their streak!

Hey ProductHunt!
Trophy is now powering over 24M streaks which is kind of crazy to think about considering we only launched 1.0 here in January this year.
One of the parts I find most interesting about building horizontal infrastructure is that as you scale and power more and more products you get to see insights that most teams building in isolation will only see a part of, and you can use those insights to make the the infrastructure better for everyone.
For example, because we power streaks for so many users, Trophy can tell that 25% of all streaks are lost on a Friday, closely followed by Saturday (19%) and then Wednesday (18%).
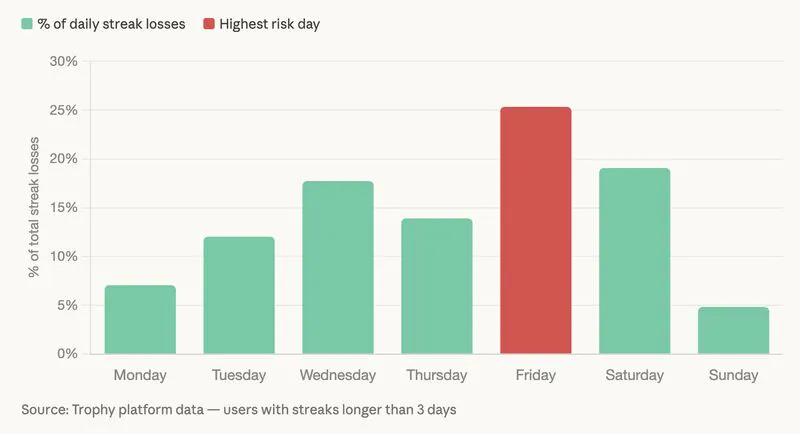
This is across all products Trophy powers, but we can use this to back up insights for each products specific use case and start powering advanced features for them.
The most obvious next step from here is to start working on improving our streak infrastructure to personalize streaks reminders for each user, including sending targeted reminders based on when each user is most likely to lose their streak.
Lot's more insights like this to follow!
Happy building!
Charlie
Replies
Hot take: weekend streak drops might not be a problem, could just mean people are living more freely?
Trophy 1.0
@naomi_florence1 Yeah not necessarily a 'problem', unless people come back on Monday and have lost all their progress. If your product is truly a daily product, then weekends matter too, but most aren't truly daily.
@charlie_hb So it's less a "problem spike" and more a reflection of how routines naturally shift across the week.
How much of this is day-based vs time-of-day behavior, (like late-night drop-offs)?
Trophy 1.0
@leah_josephine That's actually a great question, we'll look into this for sure.
@charlie_hb Curious to see what you find!
What % of users, actually recovered their streak after breaking vs churn completely?
Trophy 1.0
@miles_anthony2 Great question. Here's some data on that. This is percentage of users that return to start another streak after losing one vs length of that original streak. Users with longer streaks are more likely to return, which is why holding average streak length as a key metric is super important if you want to increase retention in general.
@charlie_hb That's a really strong signal, especially that 31-60 day jump. Feels like the longer the streak survives, the more it becomes part of user habit rather than just usage.
Wednesday being high is interesting, that mid-week motivation dip is real across products.
Do your users struggle more on weekends or weekdays? @judit10
How do you currently prevent streak drop offs? .
Trophy 1.0
@hannah_moowattin Couple of things. We have automated reminders that our customers can set up to send to their users. These can be emails or push notifications. We also have streak freezes. Each customer can configure how many streak freezes their users should start with, and how many to give them over time e.g. "2 freezes a week" or "1 freeze a month". Trophy then automatically uses up streak freezes on behalf of users if they are about to lose their streak and grants them to users based on the configuration. I'll probably do a separate thread on the impact of freezes but at a high level we see average streak length increase ~ 50% for customers that enable freezes compared to those that don't.
That Friday spike is actually not surprising when I think about it. My routines usually break a bit going into the weekend, so it makes sense that streaks drop there
@rahul_manjhi1 I am curious how much this varies by use case. I feel like fitness streaks and learning streaks might behave differently even if the overall trends looks similar.
Trophy 1.0
@rahul_manjhi1 @nitesh_kumar98 Fitness tends to be more of a weekly use case, so a weekly streak is usually a better fit. The data in this thread is solely for daily streaks and weekly probably looks a bit different. We do track weekly streaks for some products though so I'll look into this!
minimalist phone: creating folders
Just out of curiosity – do you know the cause?
Trophy 1.0
@busmark_w_nika As this looks across all the products we support it's difficult to point to one specific cause. Our customers are mostly consumer-focused mobile and web apps, and usage patterns tend to vary by industry. Edtech for example gets more usage during the week when people are studying, whereas other types of platforms like gaming tend to be busier during the weekend when people are a bit more chill. As we scale we plan to break this down by industry, and I expect the patterns and causes will become clearer.
minimalist phone: creating folders
@charlie_hb I think it would be useful to see the reasons (so I would know what to avoid) :D
25% on Fridays makes sense. That is when the week mentally ends for most people, even if the calendar does not.
We are building around a similar problem, not streaks, but the habit of recording expenses at the moment they happen. The twist: everything runs on-device, so we actually cannot see our own users drop-off patterns. Privacy by design, blind spot by design.
That 24M data set must tell a story most of us building habit-dependent products would pay to read.
25% on Fridays actually makes a lot of sense, motivation drops right when people “switch off”.
Streak systems are way more about timing psychology than people think.
Trophy 1.0
@judit10 Exactly right, that's why peronsalization of experience is so important.