


A typical day with Okiela
The other day a small DTC founder DM’d me:
“Revenue looks fine on Shopify, but every month I stare at the numbers and still don’t know if I actually made money.”
He sent me 2 files:
– Shopify Orders CSV
– His own COGS spreadsheet (SKU, unit cost)
His routine looked very familiar:
– Print Shopify revenue
– Open 2–3 Excel files
– Manually subtract COGS, ad spend, shipping, random fees
– Stay up late, end up with a profit number he doesn’t really trust
I asked him to try Okiela the way it is today:
– Upload the Shopify Orders CSV
– Import his COGS sheet
– Add a few big cost buckets (ads, payroll, apps)
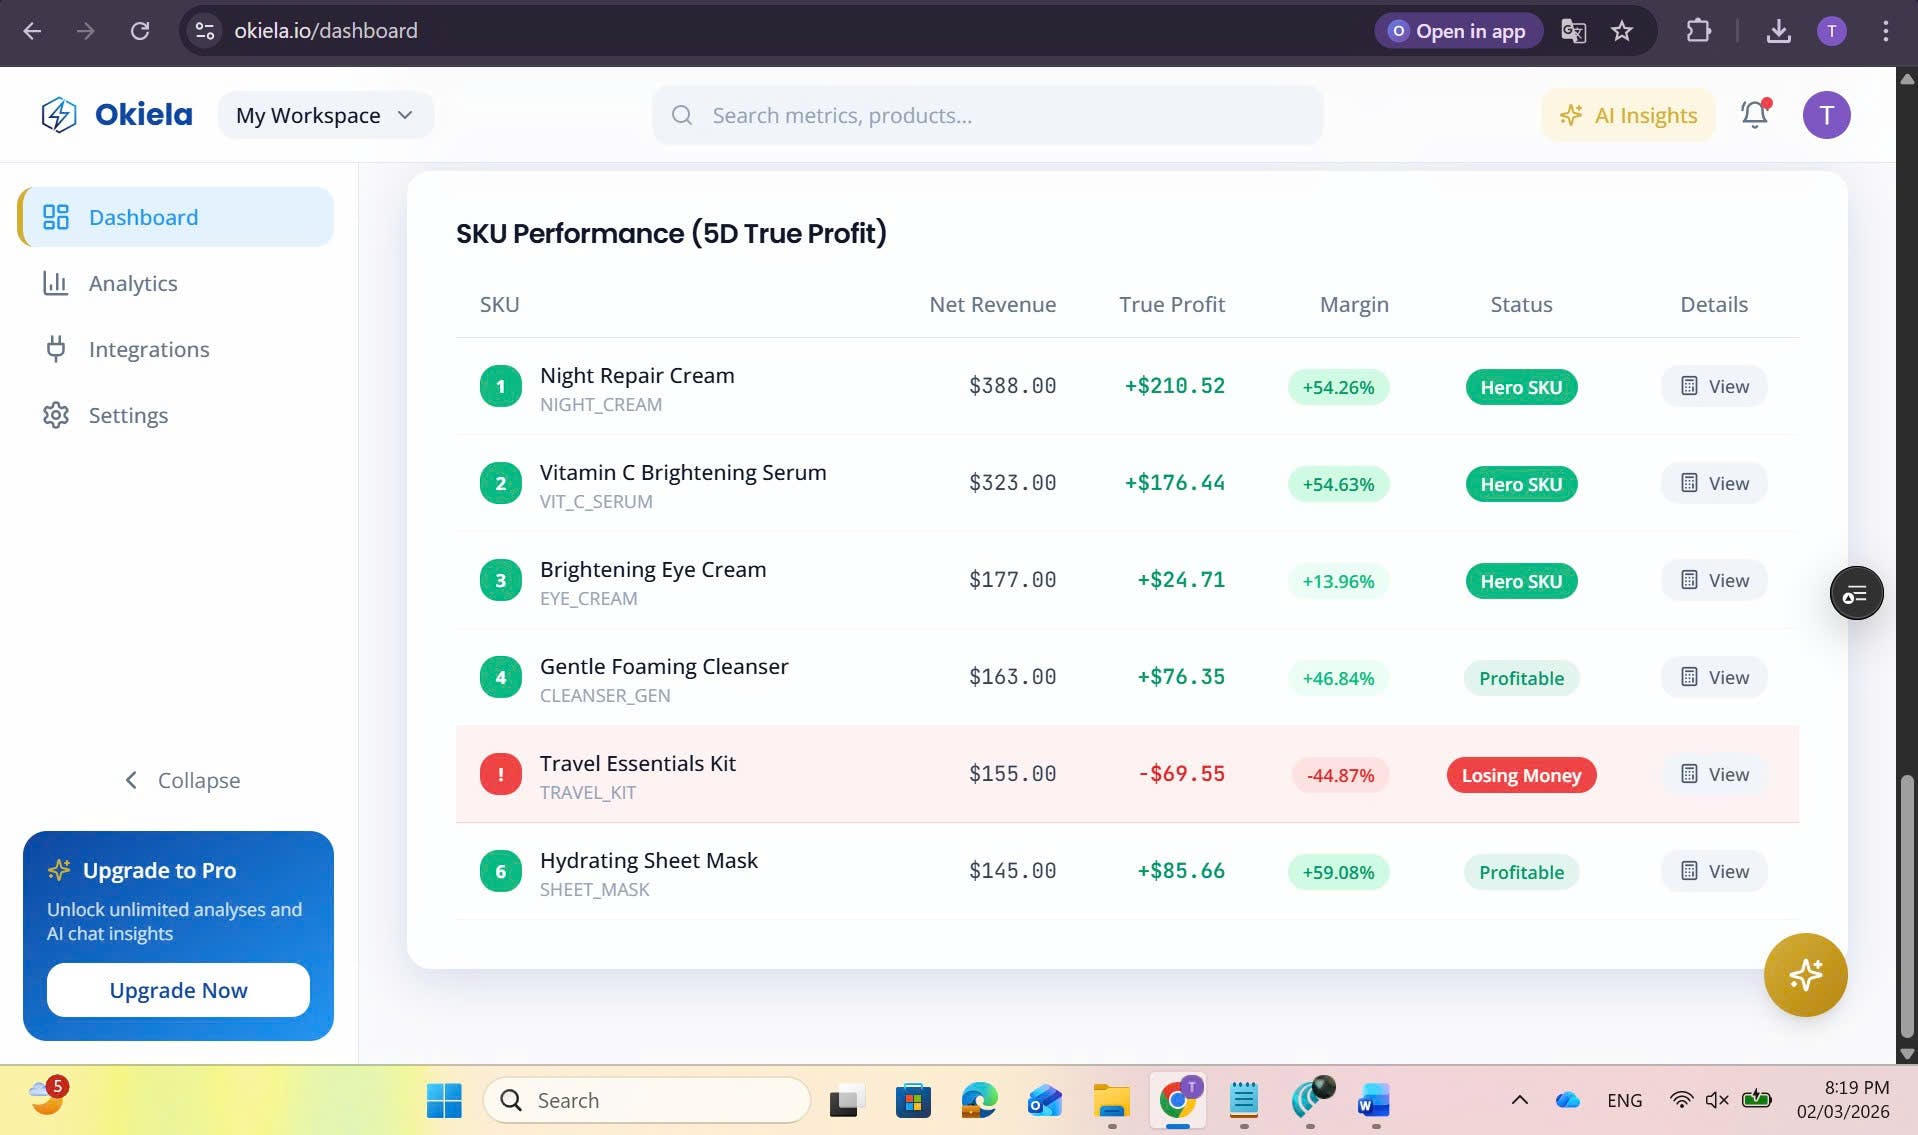
Maybe 30 seconds later, the dashboard showed:
– The SKUs that are actually paying the bills
– Two “best‑sellers” that are basically breakeven once all costs are in
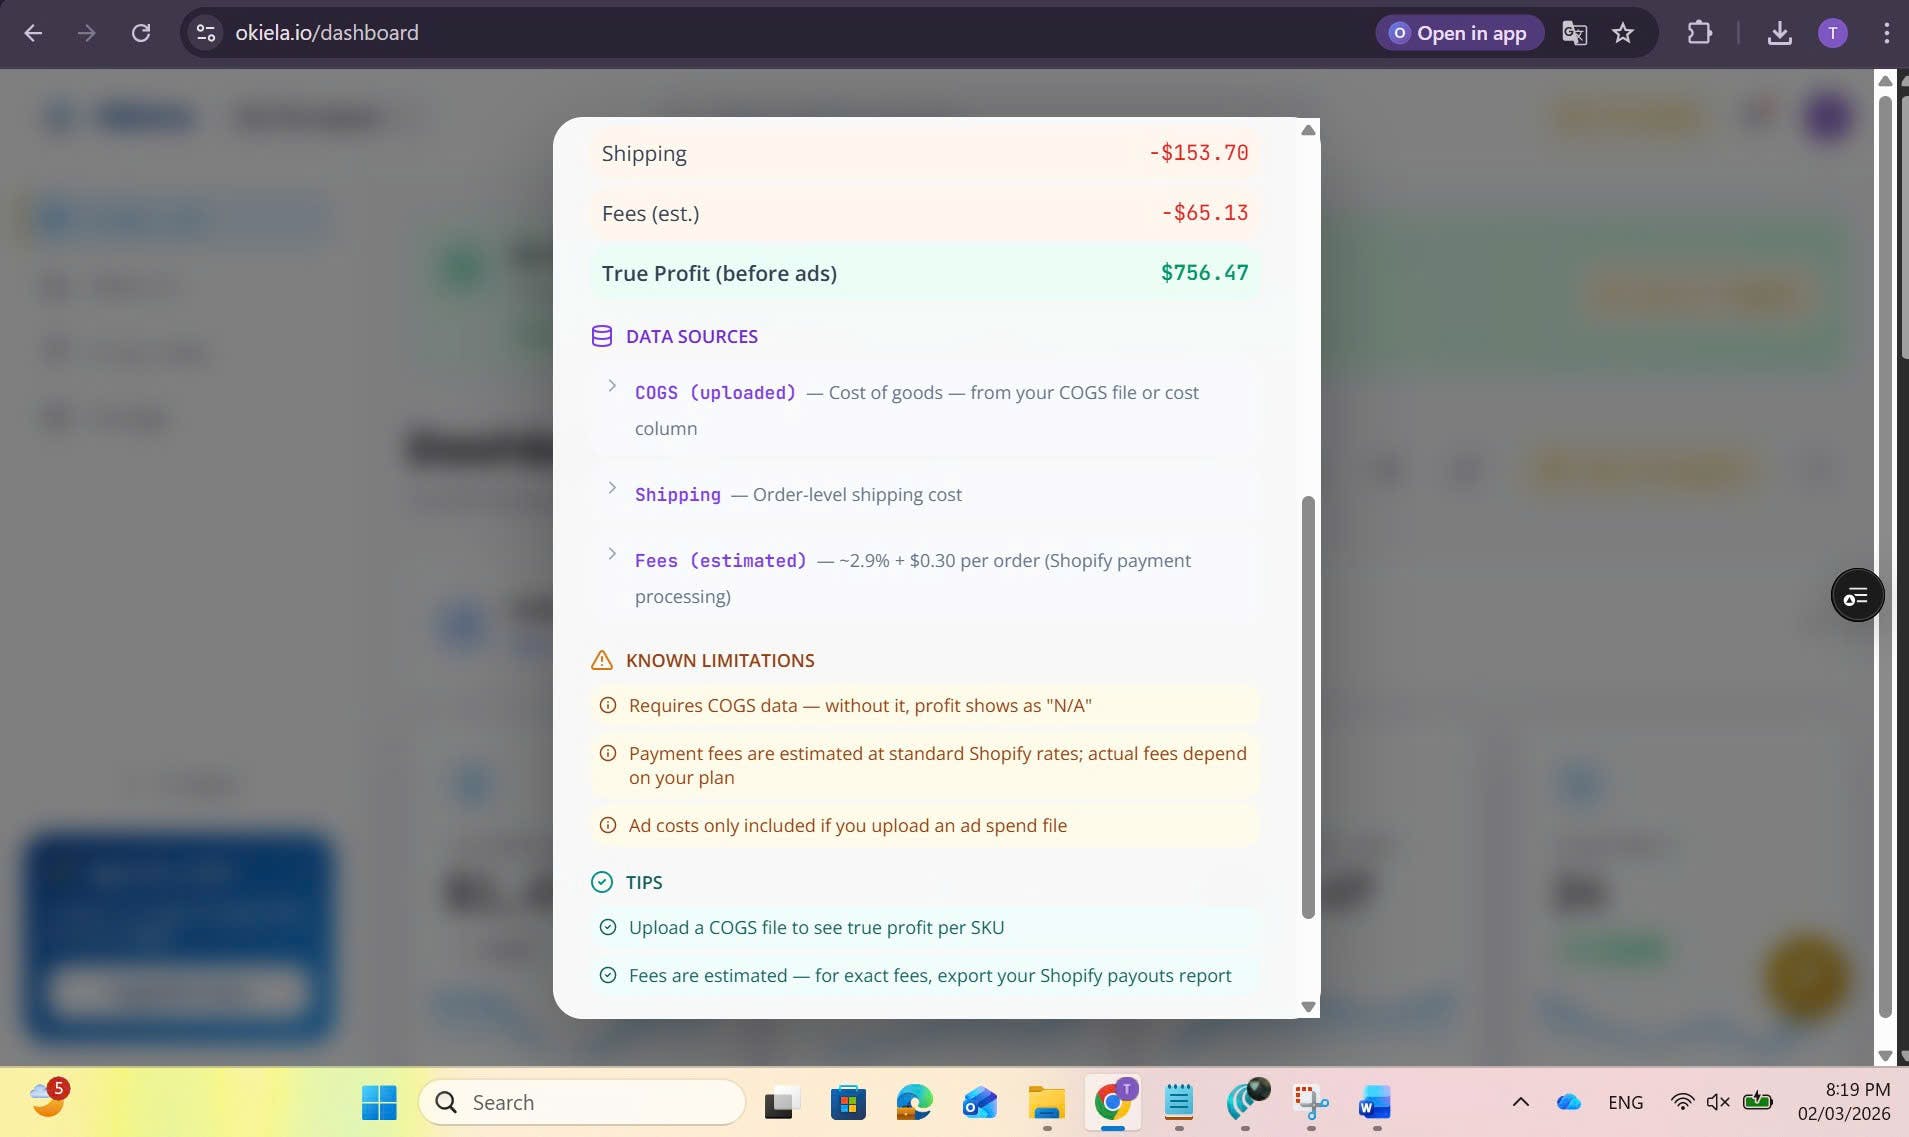
– A bunch of small fees adding up to a bit over 10% of revenue
He opened the AI chat on the side and asked:
“What should I fix first?”
The AI didn’t give a TED talk.
It just said things like:
– These SKUs can handle a small price increase
– This one has been unprofitable for 3 months even with decent ROAS
– Shipping to these regions is way more expensive than the rest
His reply was: “I don’t need another shiny dashboard. I just need something that tells me what’s feeding me and what’s bleeding me.”
That’s pretty much what Okiela does right now.
Nothing fancy:
– Take your Shopify Orders export
– Add COGS and a few main costs
– Show you SKU‑level profit and a couple of straightforward moves
The bigger stuff is still in the oven, so I’d rather earn trust with this first.
------------------
#buildinpublic #analytics #data #shopify #ecommerce #saas #solofounder #okiela
*(Note: illustrative image)


Replies