As someone who teaches teens how to code, this honestly hits home.
I’ve seen so many students get discouraged not because they can’t code; but because their UI doesn’t behave the way they imagined. The button moves. The layout breaks. Something looks off most of the times and they don’t know why.
That frustration moment? That’s where many give up, especially when the tutor is not around, or when they practise at home.
What I love about this is that it closes the gap between I wrote this and why doesn’t it look right?
If a tool can actually see what rendered, reproduce the issue, and guide them toward the fix that’s not just productivity.
That’s confidence, not for only the students, but for every developer.
And confidence is everything when you’re 14, 15, 16 and trying to believe you can become a developer.
Really excited to see tools like this evolve especially for the next generation building on the web. 👏


theORQL
Hey Product Hunt!!!
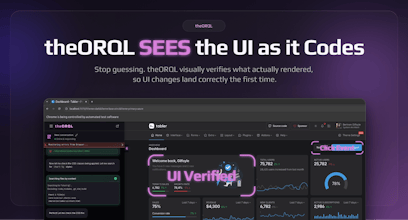
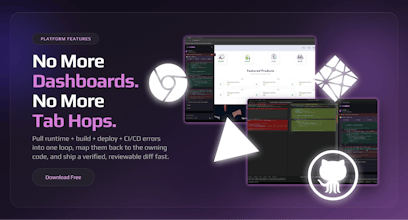
We built theORQL because most AI coding tools are blind: they generate code that looks right in text, but renders wrong in the browser.
theORQL closes the loop between your UI and your codebase:
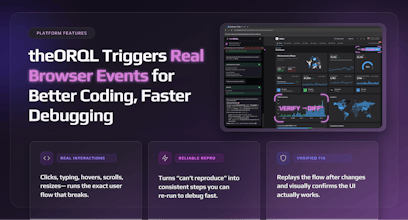
takes screenshots of the UI (full page + elements)
reads DOM + computed styles + network + console
maps a UI element to the owning component (via source maps)
applies a change, visually verifies it in the browser, then gives you a reviewable diff (no auto-commit)
If you try it, what should we focus on next: layout/CSS issues, state bugs, or flaky/hard-to-repro bugs?
And what’s one workflow you’d pay to never do manually again?
I'm very keen to try this, do you think this would have a problem with more complex UI flows using gestures (click and hold etc)? I've been working with React flow for a node interface, and debugging problems with that library is such a pain, especially when it comes to adding features like drag and drop. Would love to hear anyone's experience with this.
theORQL
@haxybaxy Thanks for your comment Zaid, and yes gesture-heavy flows (drag/drop, click-and-hold, resize handles, canvas-style UIs like React Flow) are exactly where text-only AI tends to fall apart, because the “bug” is usually in the interaction + state timing, not just the code.
theORQL can reliably reproduce the gesture and capture the right evidence (UI screenshots + DOM/state signals + console/network) while it’s happening. Simple interactions (clicks, typing, resizes) are straightforward today; more complex gestures can be trickier depending on how the library implements pointer events and what needs to be simulated.
If you’re up for it, I’d love to learn a bit:
Is it HTML/SVG/canvas in your case?
What’s the specific pain point: drag not starting, drop target logic, node position/state desync, edge routing, or performance/jank?
We can try it against your React Flow and you can see what theORQL can reproduce/verify right now (you can install it free right now and I'm happy to give you a live demo too)
@theorql Just to clarify React Flow is a library for making n8n-like interfaces, not something personal to me. It would be a bunch of HTML and SVG components, in my case and the pain point would be edge routing, where the edges between the nodes were not completely lined up with the nodes, and I had to constantly mess with transformations that all went into effect at different points. The jank was also a major problem as I had to override the defaults quite a bit to get what I wanted out of the library.
The vision-based verification loop is what makes this stand out. I spend way too much time on the "tweak CSS, refresh, check, repeat" cycle — having something that can actually see the rendered output and confirm the fix landed correctly before I commit sounds like it'd save me hours every week. Curious how it handles responsive layout bugs across breakpoints.
theORQL
@letian_wang3 Thank you Letian, That’s exactly the loop we built theORQL for.
For responsive bugs, the flow is basically: we reproduce the issue at the breakpoint by resizing (or setting a specific viewport), capture what actually rendered (screenshots + computed styles), map the affected element back to the owning component, apply the change, then re-check the same viewport to confirm the screenshot matches the intended layout before handing you the diff.
Honest take: I ignored this at first because "Cursor for frontend" sounds like marketing. Then I saw the visual verify loop -screenshot, fix, check in browser, diff. That's not Cursor. That's something Cursor can't do. The bet that AI dev tools need vision, not just bigger models, is one I'd put money on. For next focus - layout/CSS issues. That's where the gap between "code looks right" and "renders wrong" is widest.
This is such a unique take on frontend dev, especially for backend developers like me.
theORQL
@new_user_2790a57d4d Thanks Faizan!! theORQL is really solid on backend bugs even though we're focused on Frontend. In fact our next release is going to focus on multi-repo resolution - many of our users face bugs that span multiple repos/services. So backend is a focus of ours too.
What is your biggest backend debugging pain?
theORQL
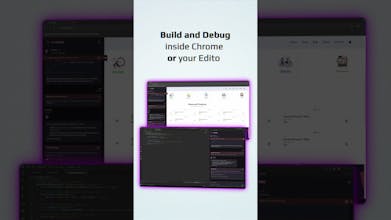
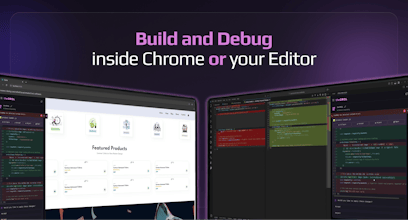
@new_user_2790a57d4d Thank you for your interest in theORQL! As a backend developer too (primarily C#) I find it tedious to navigate Dev Tools to debug console errors. Plus I often get lost in the CSS soup found in the Elements tab. theORQL captures console errors in its chat/UI, and its Element Selector makes finding code around page elements a breeze. And it offers this within Chrome! Or your IDE. Please try it for free and let us know what you think.
AI Made Coding Faster But Debugging Is Still Stuck in the past. After 10+ years as a software engineer, one thing hasn’t changed: Debugging is where most of the real time is lost.
The ability to captures runtime errors directly from Chrome:
• stack traces with real values
• DOM & component state
• network failures
• user interactions
is impressive, highly recommend this tool !!!
theORQL
@_jaydeepkarale thank you Jaydeep! We are so grateful for the outpouring of support from our users. What would you like to see next from theORQL?
Adjust Page Brightness - Smart Control
this is one of the greatest products i have ever seen on product hunt, very helpful for developers like me
theORQL
@kshitij_mishra4 Thank you so much!! What is the biggest pain you're having in your workflow? We want to help :saluting_face: